Fig. 10.
Download original image
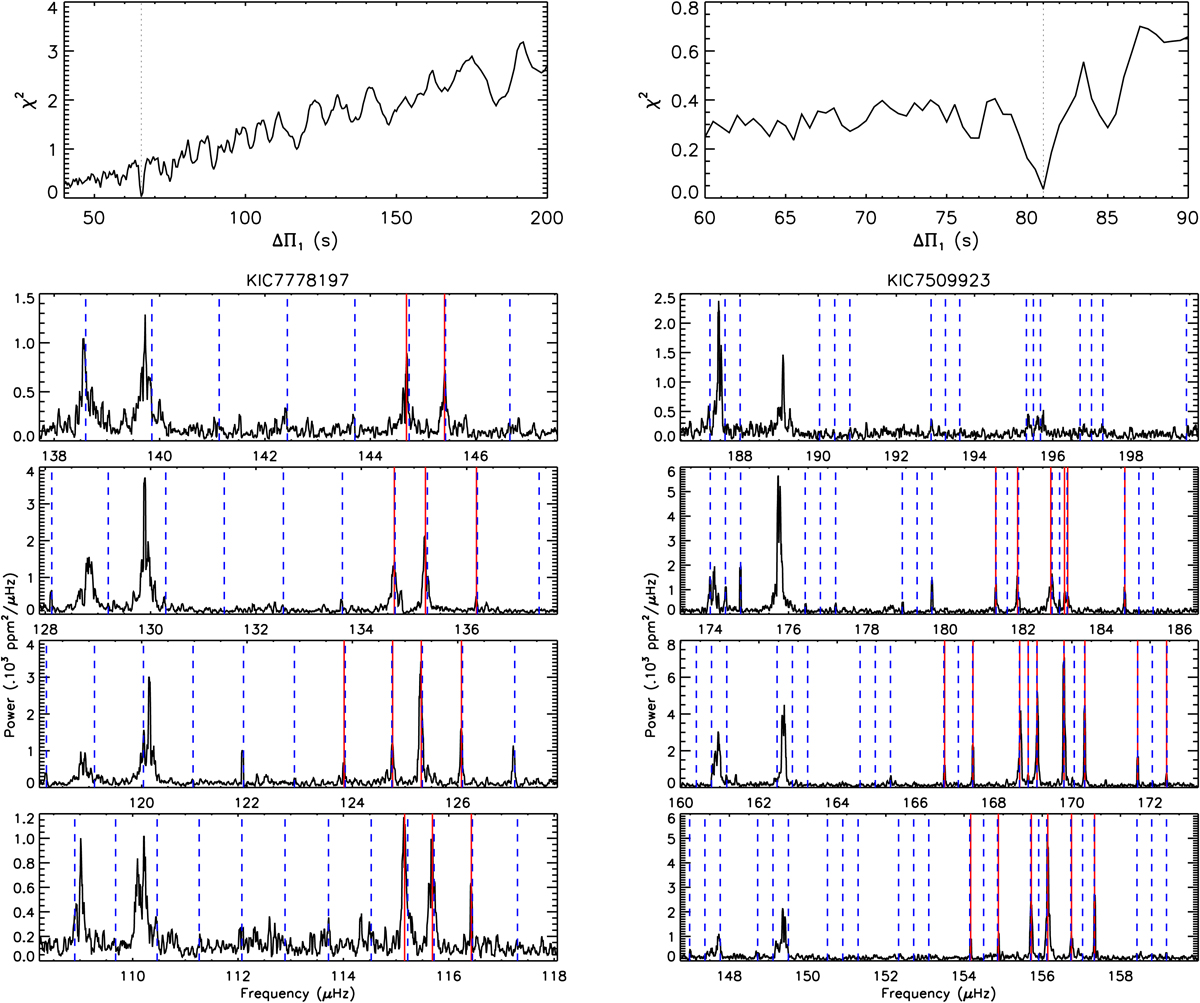
Estimate of ΔΠ1 for KIC7778197 (left panels) and KIC7509923 (right panels) using the method presented in Sect. 5.2 and Appendix A. Top panel: optimal values of χ2 (see Eq. (A.9)) obtained for each tested value of ΔΠ1. The vertical dotted line indicates the best fit to the data. Bottom panel: oscillation spectrum shown in the shape of an échelle diagram. Blue vertical dashed lines correspond to the best fit to the detected peaks, which are indicated as red vertical solid lines. No clear signature of rotation was found in the spectrum of KIC7778197, whereas it is evident for KIC7509923 (see text).
Current usage metrics show cumulative count of Article Views (full-text article views including HTML views, PDF and ePub downloads, according to the available data) and Abstracts Views on Vision4Press platform.
Data correspond to usage on the plateform after 2015. The current usage metrics is available 48-96 hours after online publication and is updated daily on week days.
Initial download of the metrics may take a while.