Fig. 2.
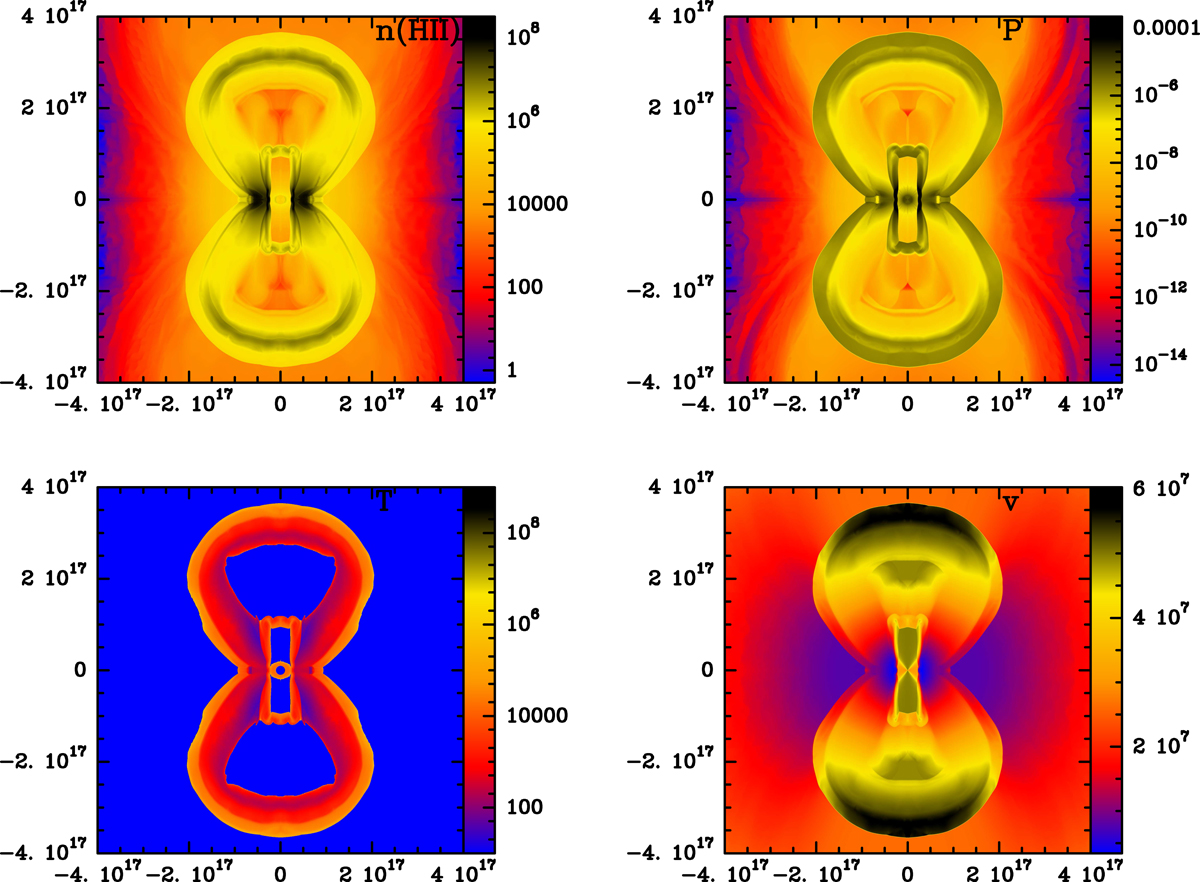
Download original image
Stratifications for Run A of density of ionized hydrogen (top left), pressure (top right), temperature (bottom left), and velocity (bottom right) computed 172 yr after the great eruption of η Car. The bars on the right side of the panels are in units of cm−3, dyn cm−2, K, and cm s−1, respectively, and the computational domain axes are in units of cm. A further description of the figure is given in the text.
Current usage metrics show cumulative count of Article Views (full-text article views including HTML views, PDF and ePub downloads, according to the available data) and Abstracts Views on Vision4Press platform.
Data correspond to usage on the plateform after 2015. The current usage metrics is available 48-96 hours after online publication and is updated daily on week days.
Initial download of the metrics may take a while.