Fig. 9.
Download original image
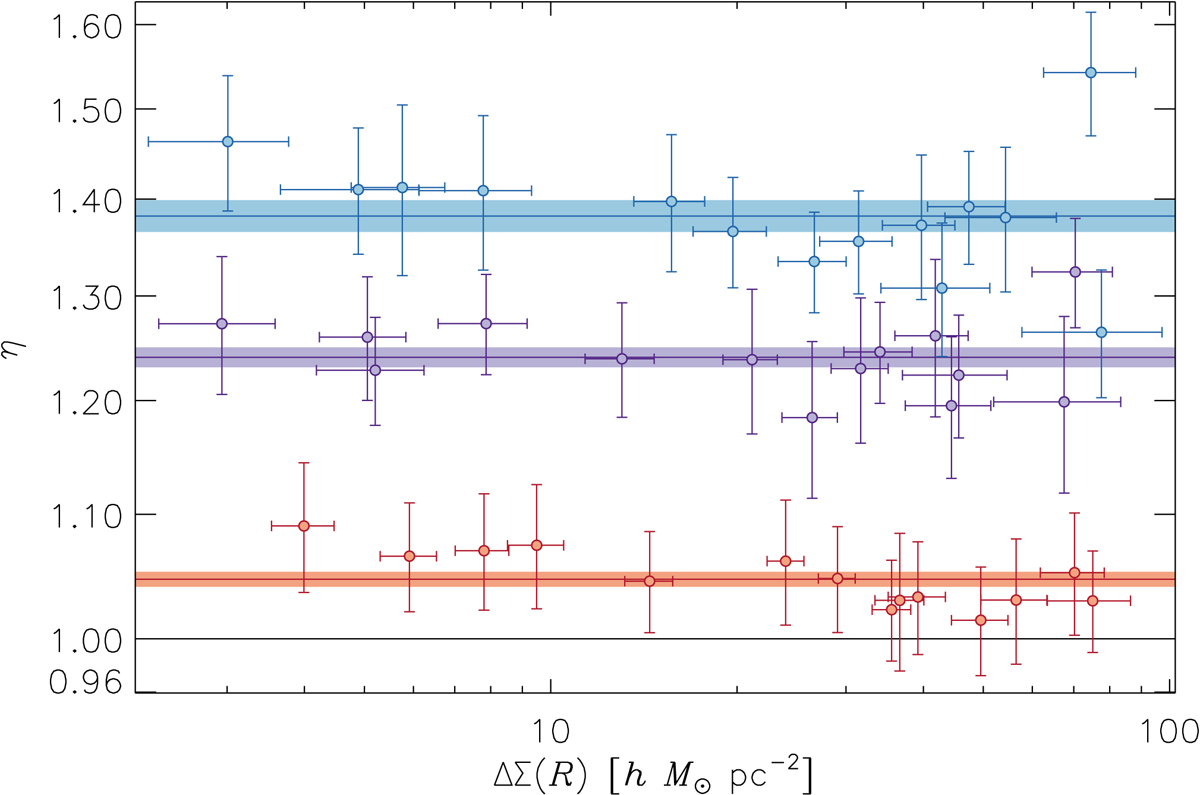
Relative efficiencies, ![]() , defined as the ratio of the diagonal elements of the covariance matrices. The relative efficiencies using the full KiDS-450 source catalog are shown in red. The purple and blue represent the higher S/N and higher lensfit weight selections, respectively. The solid lines represent the average η for each selection, with the shaded regions showing the 1σ errors.
, defined as the ratio of the diagonal elements of the covariance matrices. The relative efficiencies using the full KiDS-450 source catalog are shown in red. The purple and blue represent the higher S/N and higher lensfit weight selections, respectively. The solid lines represent the average η for each selection, with the shaded regions showing the 1σ errors.
Current usage metrics show cumulative count of Article Views (full-text article views including HTML views, PDF and ePub downloads, according to the available data) and Abstracts Views on Vision4Press platform.
Data correspond to usage on the plateform after 2015. The current usage metrics is available 48-96 hours after online publication and is updated daily on week days.
Initial download of the metrics may take a while.