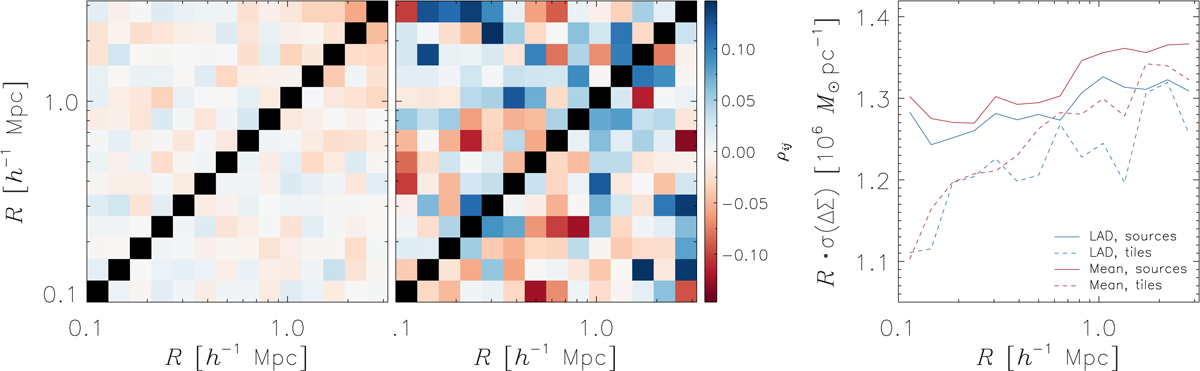
Fig. A.4.
Download original image
Left: Correlation derived from bootstrapping the signal by individual sources; same as Fig. 6, but with the color stretch adjusted to the middle plot. Middle: Correlation derived from bootstrapping the signal in 1 deg2 tiles. The upper-left corners show the correlations from LAD regression. The lower-right corners show the correlations from using the weighted mean. Right: Comparison of the errors obtained from bootstrapping sources (LAD: solid blue; mean: solid red) and bootstrapping 1 deg2 tiles (LAD: dashed blue; mean: dashed red).
Current usage metrics show cumulative count of Article Views (full-text article views including HTML views, PDF and ePub downloads, according to the available data) and Abstracts Views on Vision4Press platform.
Data correspond to usage on the plateform after 2015. The current usage metrics is available 48-96 hours after online publication and is updated daily on week days.
Initial download of the metrics may take a while.