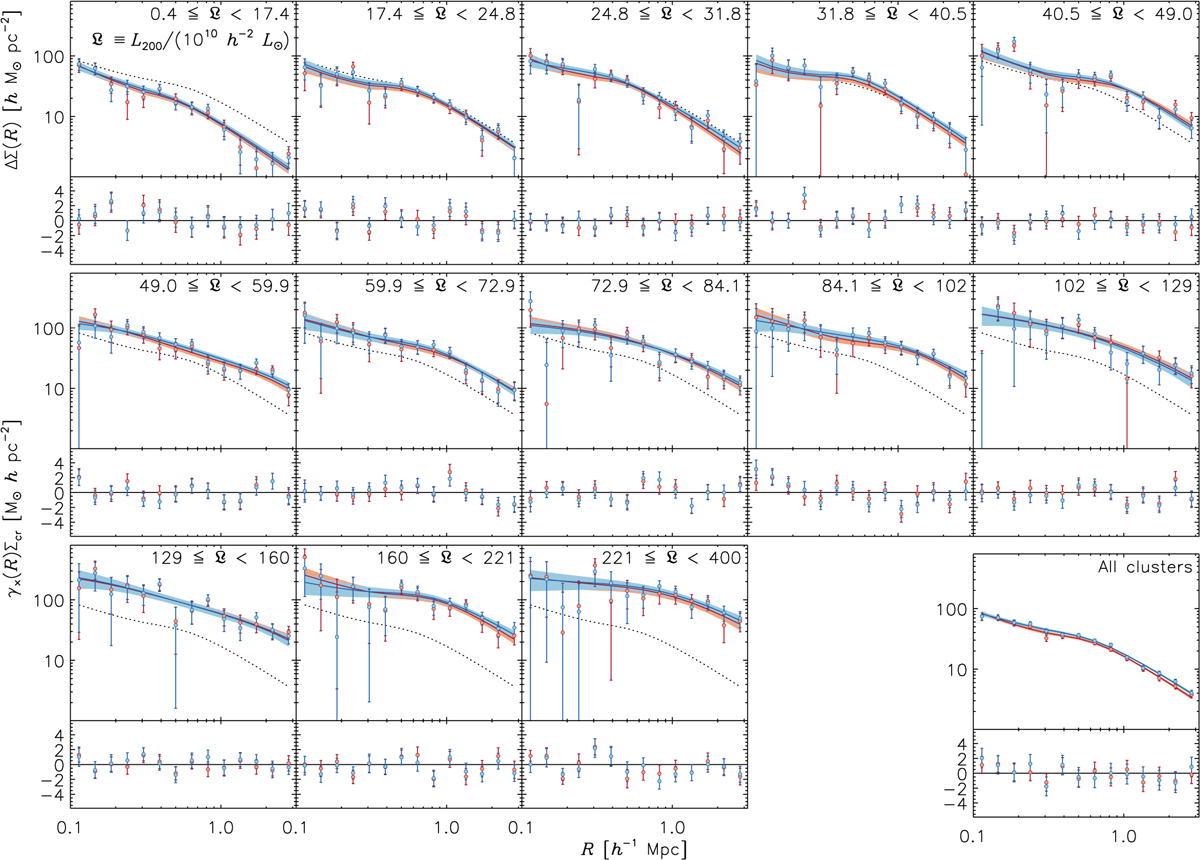
Fig. A.3.
Download original image
Estimated ESD profiles and cross signal of the 13 cluster bins, using the LAD estimator (blue) and a weighted mean (red). The error bars are the square roots of the diagonal values of the respective covariance matrices. The solid lines represent the best fitting halo model obtained by the MCMC fit. The shaded regions show the 68.3% confidence bands, estimated using the 15.9th and 84.1th percentiles of the MCMC realizations. Individual bins are indicated by the range in normalized luminosity, 𝔏 ≡ L200 /(1010h−2 L⊙). The lower-right plot shows the ESD profile estimated from the full AMICO cluster catalog, also shown in Fig. 7. The average of the two best fitting halo models from Fig. 7 are shown in each panel as a dotted line for easy comparison.
Current usage metrics show cumulative count of Article Views (full-text article views including HTML views, PDF and ePub downloads, according to the available data) and Abstracts Views on Vision4Press platform.
Data correspond to usage on the plateform after 2015. The current usage metrics is available 48-96 hours after online publication and is updated daily on week days.
Initial download of the metrics may take a while.