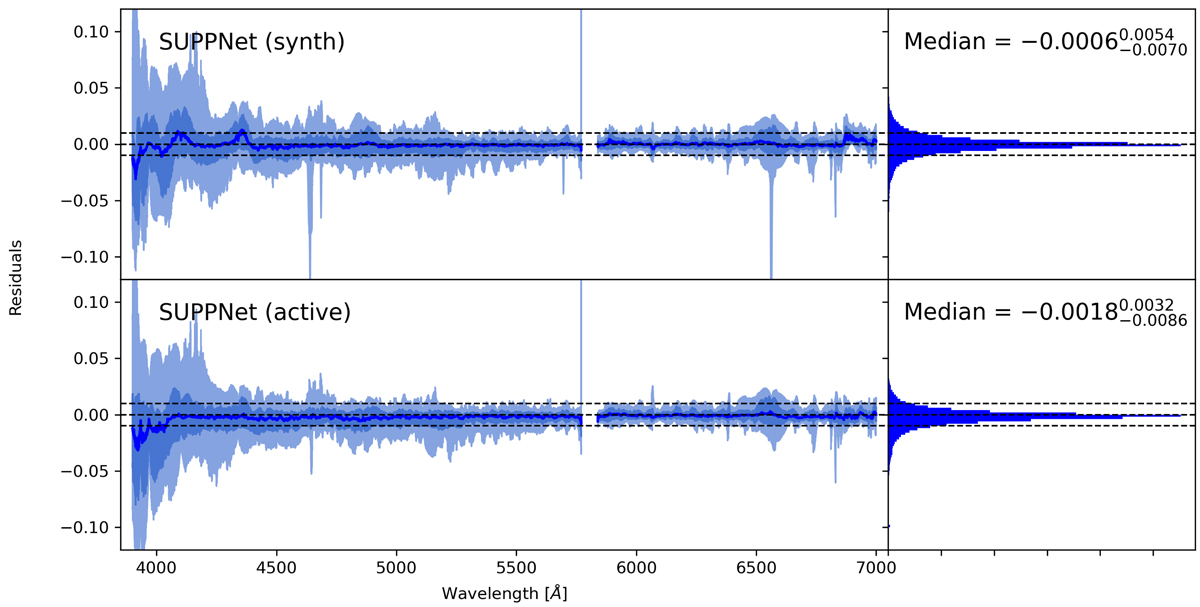
Fig. 8.
Download original image
Quality of normalisation measured using residuals between the result of the SUPPNet method and the manually normalised spectra over all stars from UVES POP field stars, which were manually normalised. The line shows the value of median for each wavelength, the shaded areas are defined to contain respectively 68 and 95 percent of values (defined by percentiles: 2.28, 15.87, 84.13, and 97.73). The upper and lower panels contain results of the algorithm that used only synthetic data for training or applied active learning, respectively. Active learning significantly reduces systematic effects for wavelengths shorter than 4500 Å.
Current usage metrics show cumulative count of Article Views (full-text article views including HTML views, PDF and ePub downloads, according to the available data) and Abstracts Views on Vision4Press platform.
Data correspond to usage on the plateform after 2015. The current usage metrics is available 48-96 hours after online publication and is updated daily on week days.
Initial download of the metrics may take a while.