Fig. 7.
Download original image
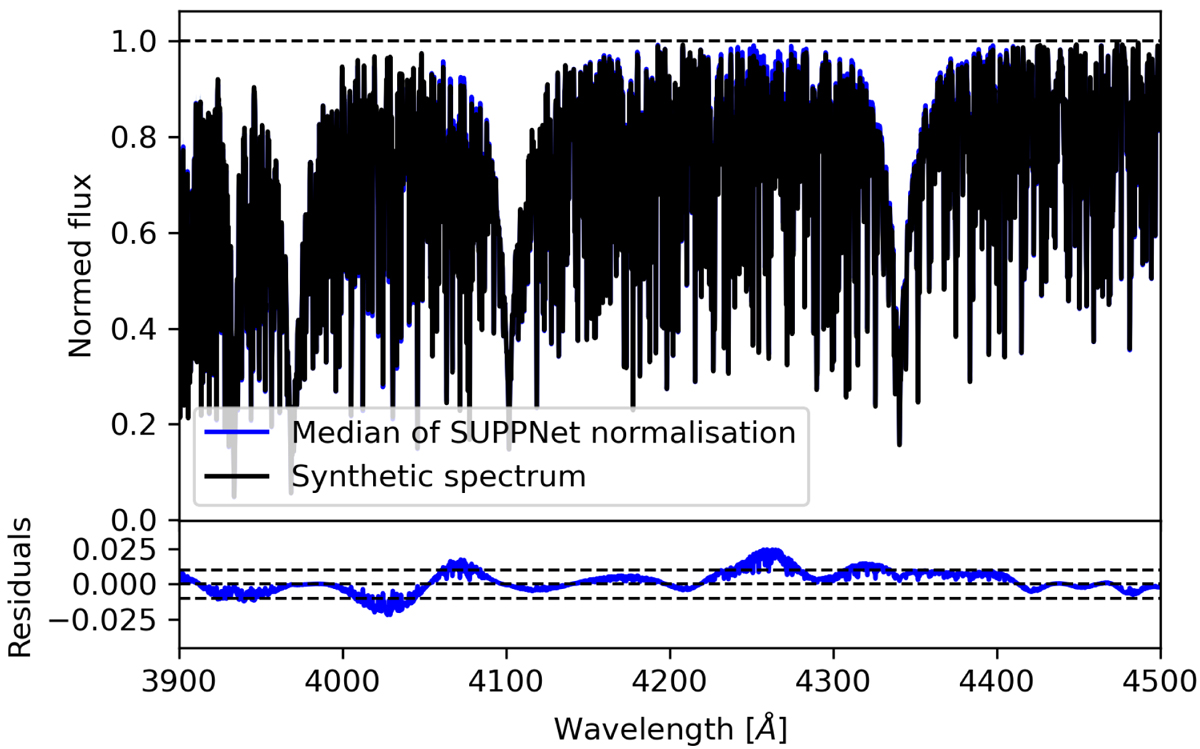
Close-up of the 3900–4500 Å spectral range of the A3 V synthetic spectrum with a median of synthetic automatically normalised spectra (top panel) and residuals of normalisation errors (bottom panel). For this particular part of the spectrum, the average normalisation is significantly biased. These differences arise due to wide hydrogen absorption lines and strong metal lines which heavily blend in this spectral range. See Fig. 6 for the remaining results.
Current usage metrics show cumulative count of Article Views (full-text article views including HTML views, PDF and ePub downloads, according to the available data) and Abstracts Views on Vision4Press platform.
Data correspond to usage on the plateform after 2015. The current usage metrics is available 48-96 hours after online publication and is updated daily on week days.
Initial download of the metrics may take a while.