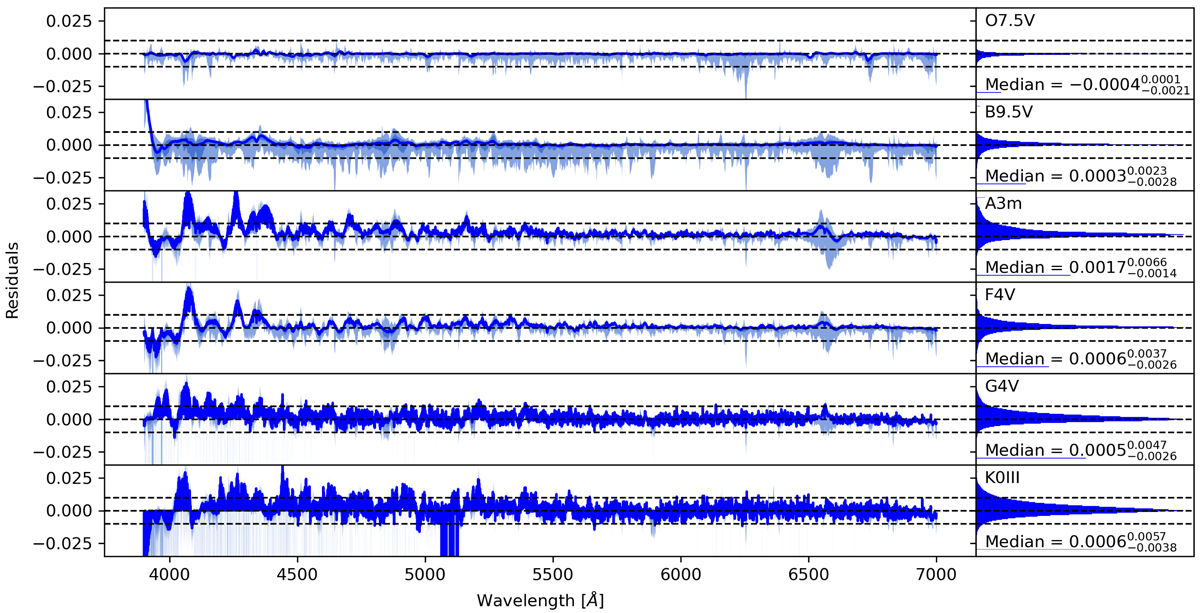
Fig. B.1.
Download original image
Results of normalisation of six synthetic spectra multiplied by six manually fitted pseudo-continua using a neural network trained only with synthetic data. In each row, on the left, the differences between automatically normalised spectra and synthetic spectrum are shown, and on the right, the histogram of those differences with a related spectral type, the median with 15.87 percentile in the upper index, and 84.13 percentile in the lower index is displayed. The dashed lines on each panel correspond to the residuals equal to -0.01, 0.0, and 0.01, respectively.
Current usage metrics show cumulative count of Article Views (full-text article views including HTML views, PDF and ePub downloads, according to the available data) and Abstracts Views on Vision4Press platform.
Data correspond to usage on the plateform after 2015. The current usage metrics is available 48-96 hours after online publication and is updated daily on week days.
Initial download of the metrics may take a while.