Fig. 11.
Download original image
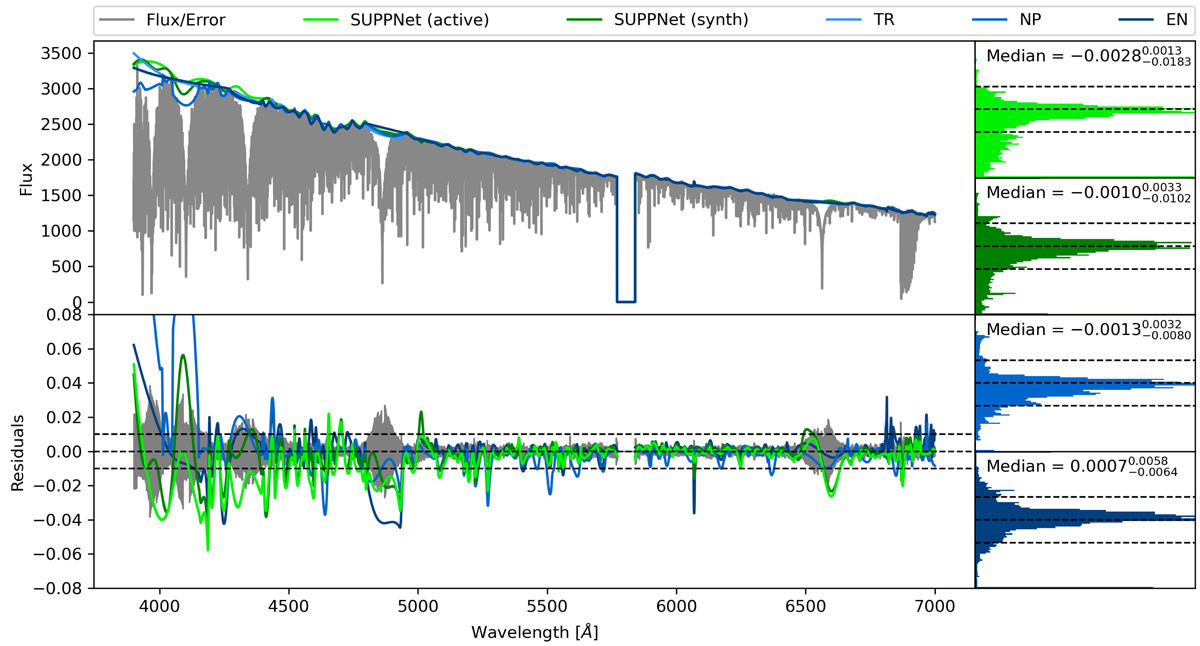
Comparison of normalisation quality using the example of HD 27411 (A3m) with two versions of the proposed method (SUPPNet active and synth) and manual normalisation performed independently by three different people (TR, NP, and EN). Upper left panel: original flux with all fitted pseudo-continua. Lower left panel: residuals of normalised fluxes relative to TR normalisation. Right panels: present histograms of all mentioned residuals with median, 15.87, and 84.13 percentiles.
Current usage metrics show cumulative count of Article Views (full-text article views including HTML views, PDF and ePub downloads, according to the available data) and Abstracts Views on Vision4Press platform.
Data correspond to usage on the plateform after 2015. The current usage metrics is available 48-96 hours after online publication and is updated daily on week days.
Initial download of the metrics may take a while.