Free Access
Fig. 1.
Download original image
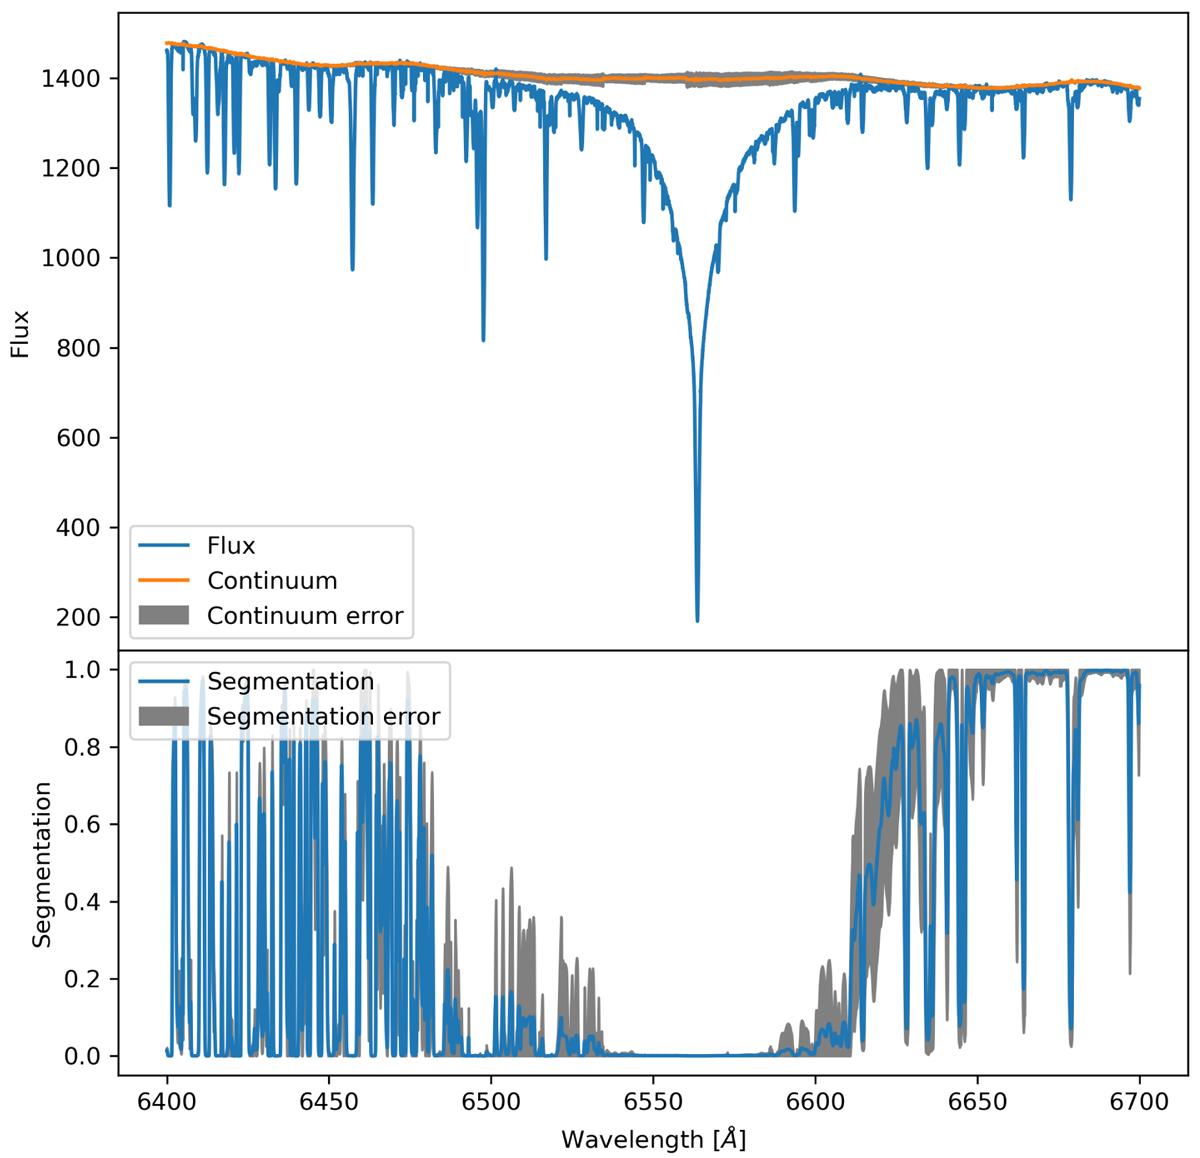
Result of HD 27411 (A3m) spectrum processing. Left upper panel: the spectrum and the predicted continuum near the Hα line. Lower left panel: the corresponding segmentation mask. The shaded area denotes the estimated uncertainty.
Current usage metrics show cumulative count of Article Views (full-text article views including HTML views, PDF and ePub downloads, according to the available data) and Abstracts Views on Vision4Press platform.
Data correspond to usage on the plateform after 2015. The current usage metrics is available 48-96 hours after online publication and is updated daily on week days.
Initial download of the metrics may take a while.