Fig. 2.
Download original image
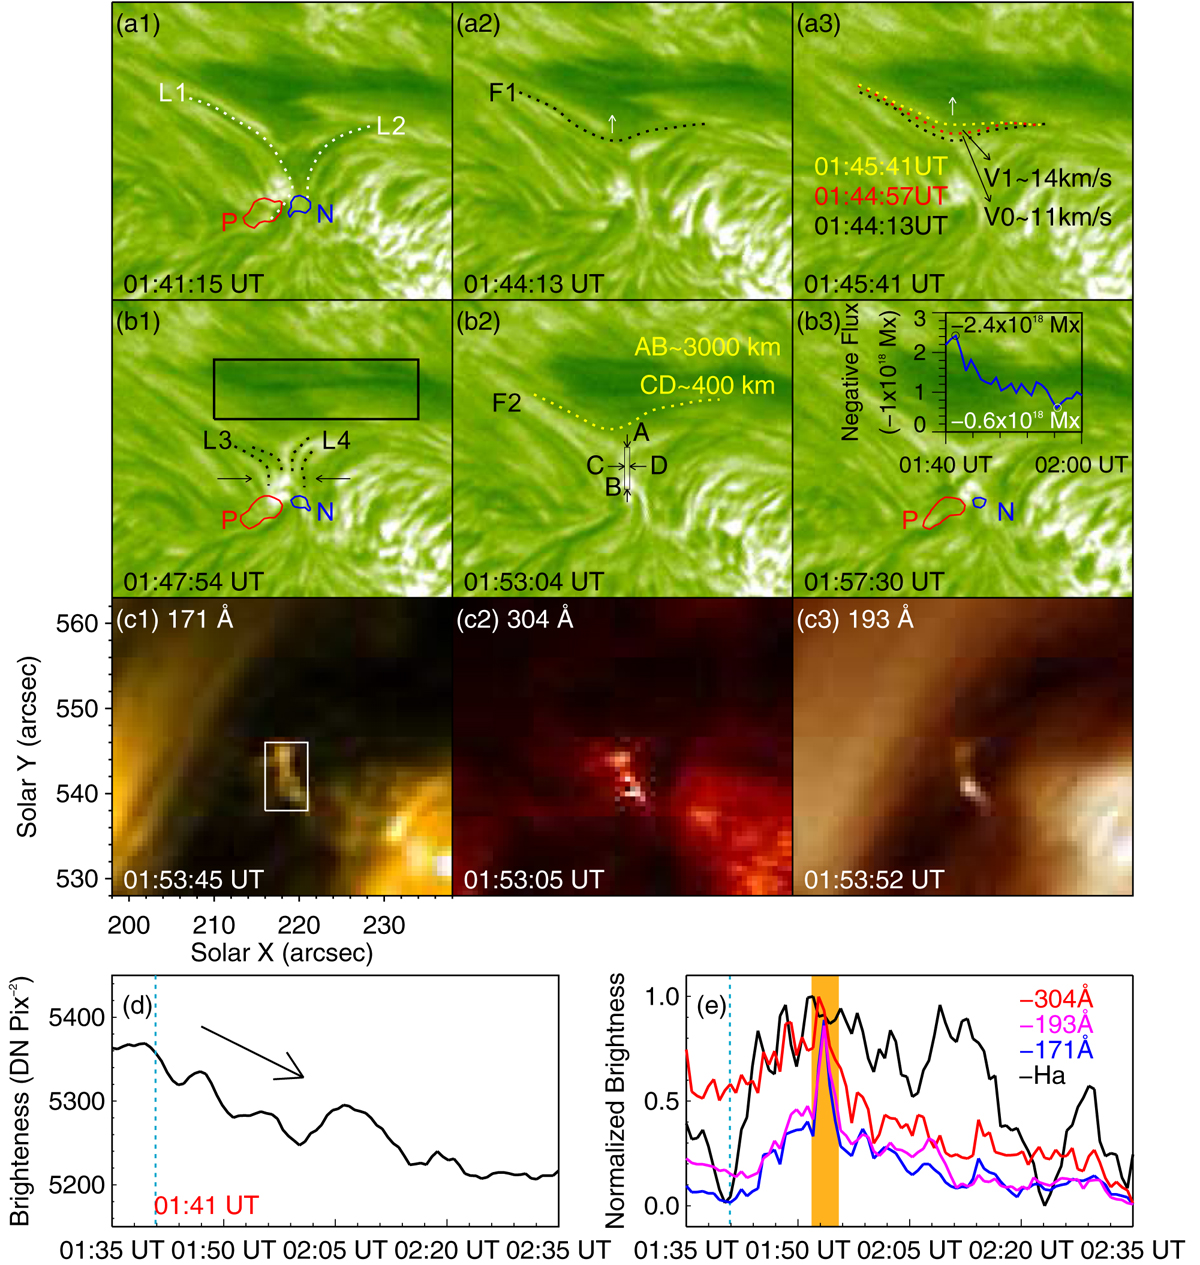
Observations of the fibril mergence and bright sheet-like structures nearby the interaction region. (a1)–(a3): interaction of two groups of chromospheric fibrils (L1 and L2) and the subsequent formation of a northward-moving longer fibril (F1). Red and blue contours in (a1) mark a pair of magnetic patches saturated in ±50 G, where L1 and L2 are rooted. Two arrows in (a2) and (a3) denote the moving direction of F1. (b1)–(b3): similar process as that in (a1)–(a3). The black rectangle in (b2) denotes a bright sheet-like structure. The blue curve in (b3) shows the evolution of the flux of N. (c1)–(c3): bright sheet-like structure in the 171 Å, 304 Å, and 193 Å channels, respectively. (d): light curve of the filament main body (the rectangle region in (b1)). (e): light curves of the interaction region (the rectangle region in (c1)) in different channels. An animation of this figure is available online.
Current usage metrics show cumulative count of Article Views (full-text article views including HTML views, PDF and ePub downloads, according to the available data) and Abstracts Views on Vision4Press platform.
Data correspond to usage on the plateform after 2015. The current usage metrics is available 48-96 hours after online publication and is updated daily on week days.
Initial download of the metrics may take a while.