Free Access
Fig. 8
Download original image
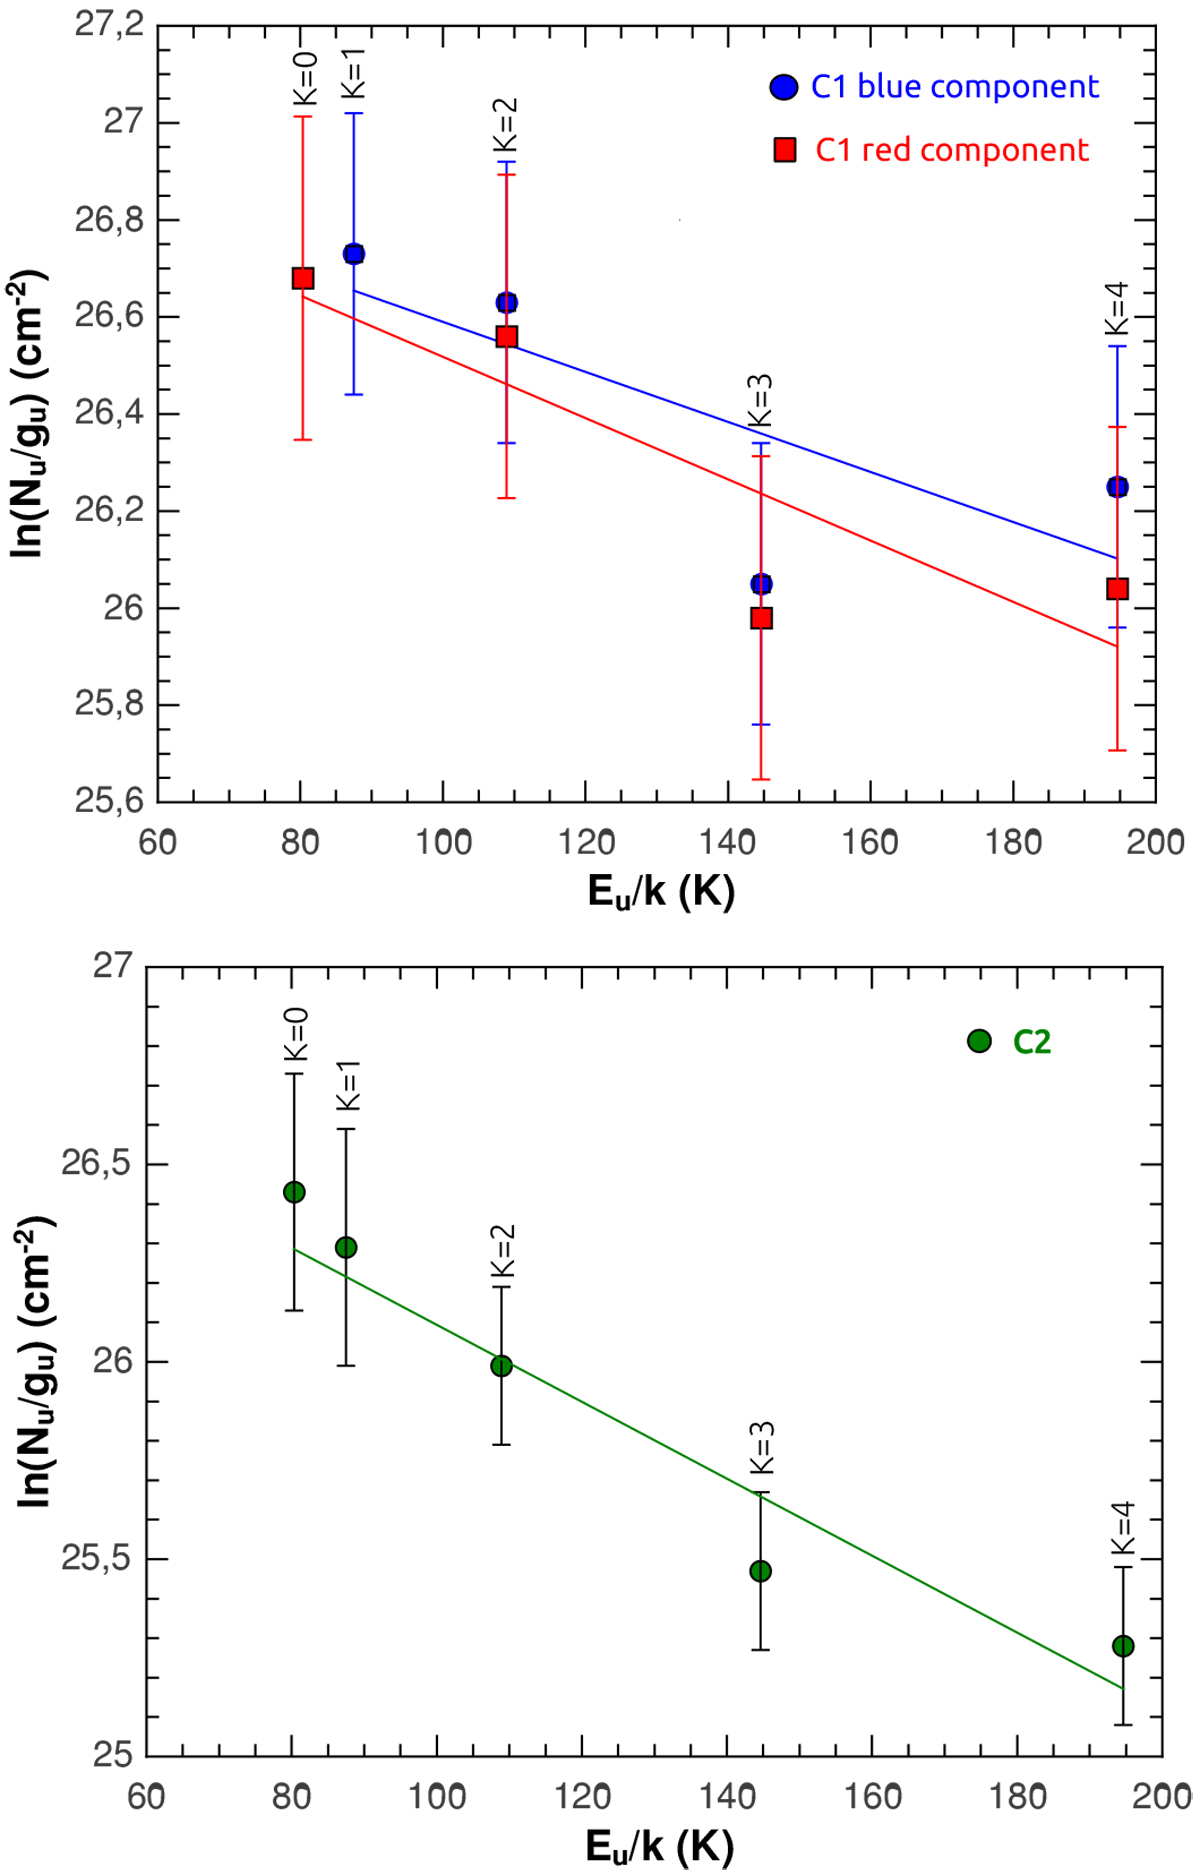
Rotational diagrams of the CH3CN J = 13–12 for the cores C1 (upper panel) and C2 (lower panel). Core C1 is separated into blue and red components. The blue component of the K = 0 projection and the red component of the K = 1 projection are not fit.
Current usage metrics show cumulative count of Article Views (full-text article views including HTML views, PDF and ePub downloads, according to the available data) and Abstracts Views on Vision4Press platform.
Data correspond to usage on the plateform after 2015. The current usage metrics is available 48-96 hours after online publication and is updated daily on week days.
Initial download of the metrics may take a while.