Fig. 6
Download original image
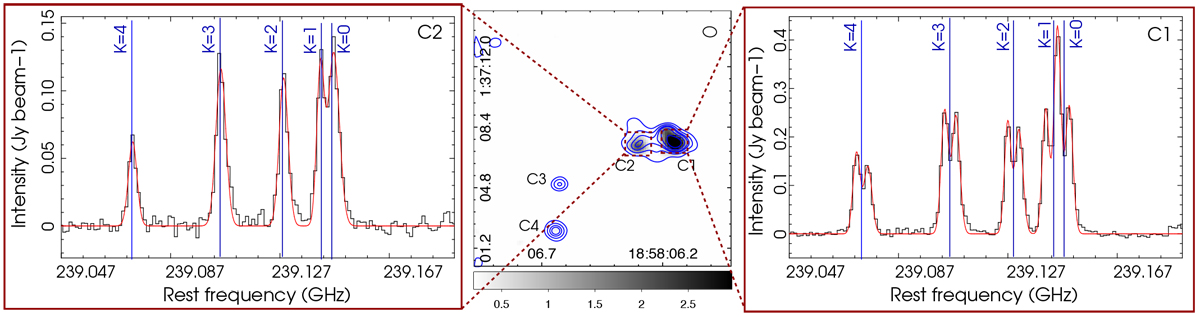
Integrated map of the CH3CN J = 13–12 emission (K = 0, 1 projections) (center). Grayscale unit is Jy beam−1 km s−1. Blue contours represent the continuum emission at 334 GHz. Levels are at 15, 30, 50, 80, 140, and 200 mJy beam−1. The beam is indicated in the top right corner. The spectra of the CH3CN J = 13–12 emission toward C2 and C1 are presented in the left and right panels, respectively. The red curves in both spectra indicate the Gaussian fittings.
Current usage metrics show cumulative count of Article Views (full-text article views including HTML views, PDF and ePub downloads, according to the available data) and Abstracts Views on Vision4Press platform.
Data correspond to usage on the plateform after 2015. The current usage metrics is available 48-96 hours after online publication and is updated daily on week days.
Initial download of the metrics may take a while.