Fig. 5
Download original image
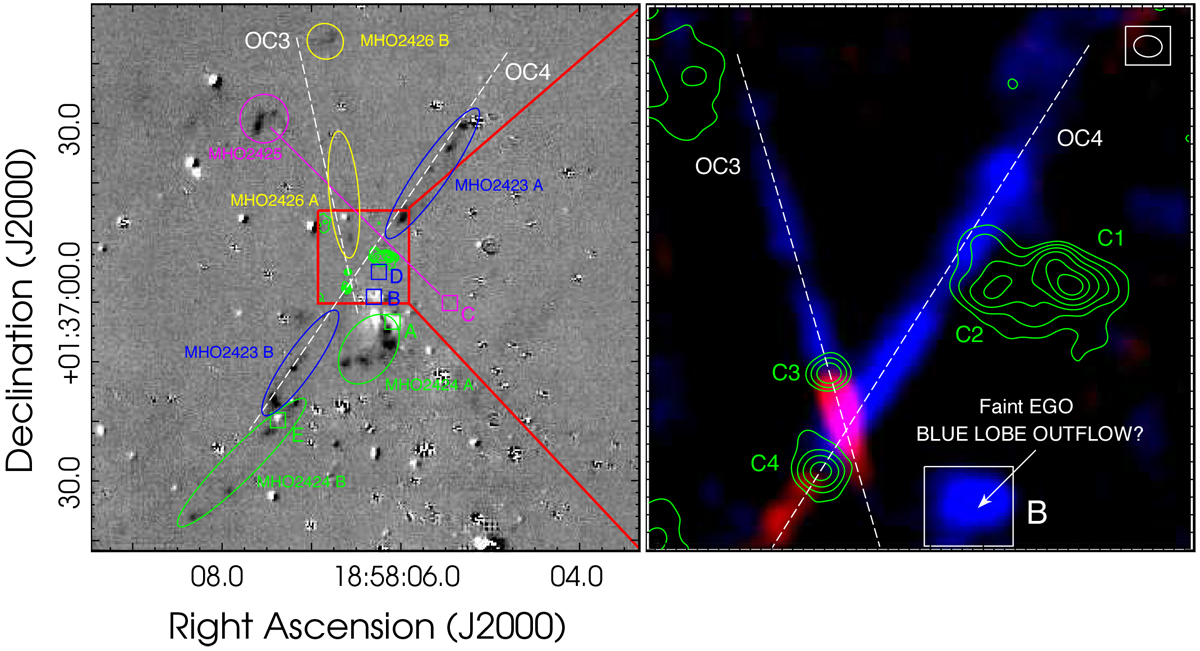
Free continuum molecular hydrogen 1–0 S(1) emission line at 2.12 μm extracted from the UWISH2 survey (left). Green contours represent the ALMA continuum emission at 334 GHz. The red square shows the field of view of the observations presented in this work. The green, blue, and magenta squares, labeled from A to E,indicate the position of the powering source candidates of the MHOs, following Froebrich & Ioannidis (2011). 12CO J = 3–2 emission distribution integrated between −18 and +24 kms−1 (blue) and between +68 and +107 km s−1 (red) (right). Green contours represent the ALMA continuum emission at 334 GHz. The beam is indicated in the top right corner.
Current usage metrics show cumulative count of Article Views (full-text article views including HTML views, PDF and ePub downloads, according to the available data) and Abstracts Views on Vision4Press platform.
Data correspond to usage on the plateform after 2015. The current usage metrics is available 48-96 hours after online publication and is updated daily on week days.
Initial download of the metrics may take a while.