Fig. 4
Download original image
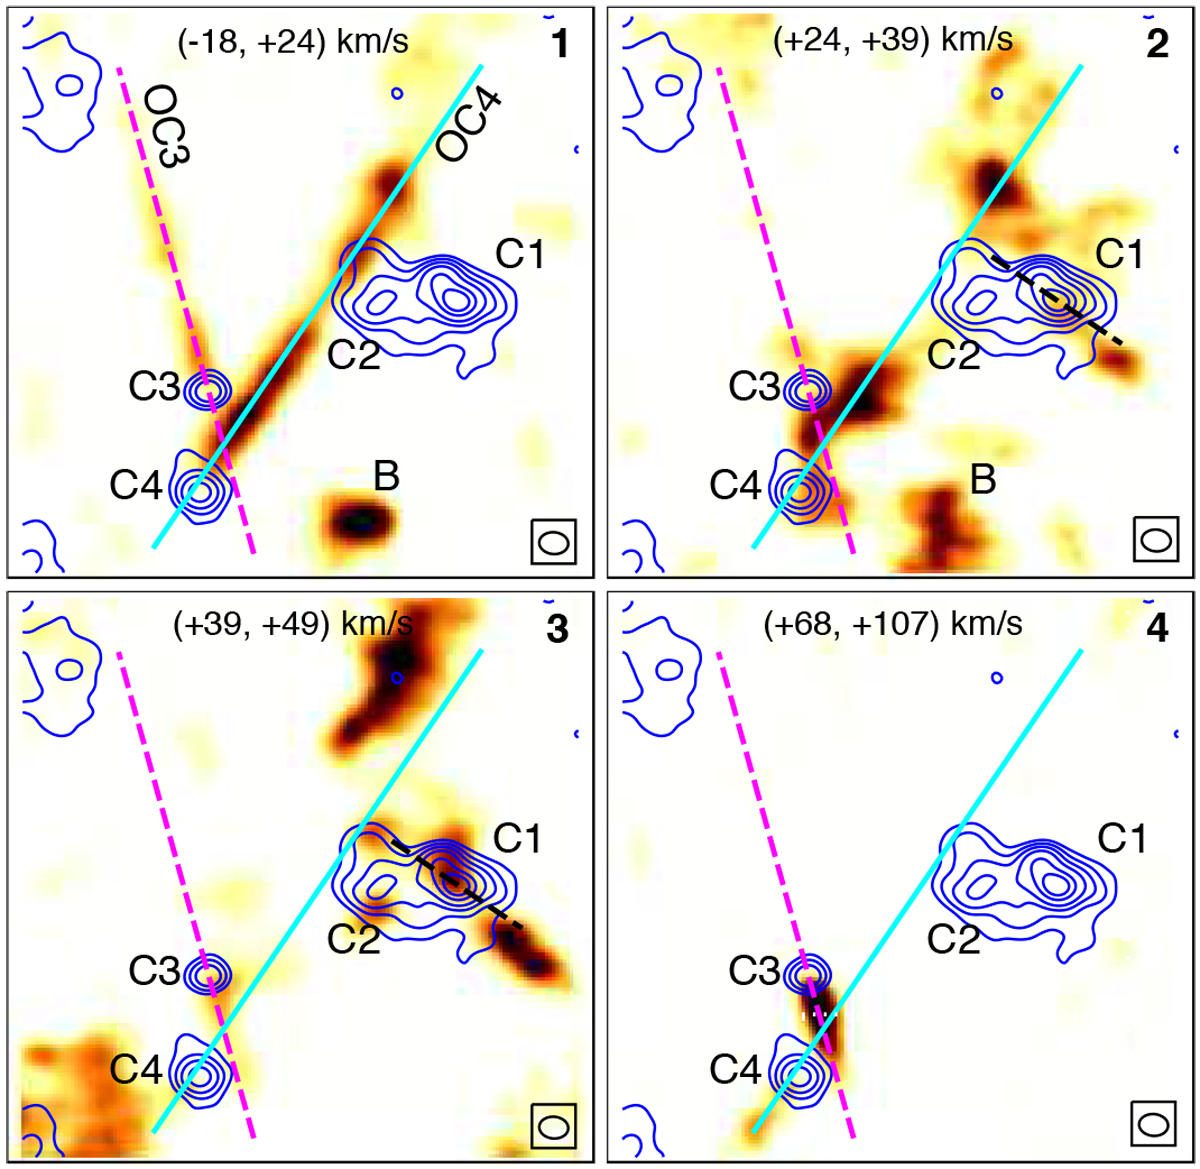
Integrated velocity channel maps of the 12CO J = 3–2 emission. The integration velocity range is exhibited at the top of each panel. The systemic velocity of the gas related to the clump AGAL35 is about 34.5 km s−1. The color scale extends from 0.8 to 16 Jy beam−1 km s−1. Blue contours represent the continuum emission at 334 GHz. Levels are at 15, 30, 50, 80, 140, and 200 mJy beam−1. The magenta and cyan lines indicate the direction of molecular outflow candidates related to the cores C3 and C4, respectively.The dashed black line in panels 2 and 3 indicates the direction of the possible rotating disk related to the core C1. The beam is indicated in the bottom right corner of each map.
Current usage metrics show cumulative count of Article Views (full-text article views including HTML views, PDF and ePub downloads, according to the available data) and Abstracts Views on Vision4Press platform.
Data correspond to usage on the plateform after 2015. The current usage metrics is available 48-96 hours after online publication and is updated daily on week days.
Initial download of the metrics may take a while.