Fig. 11
Download original image
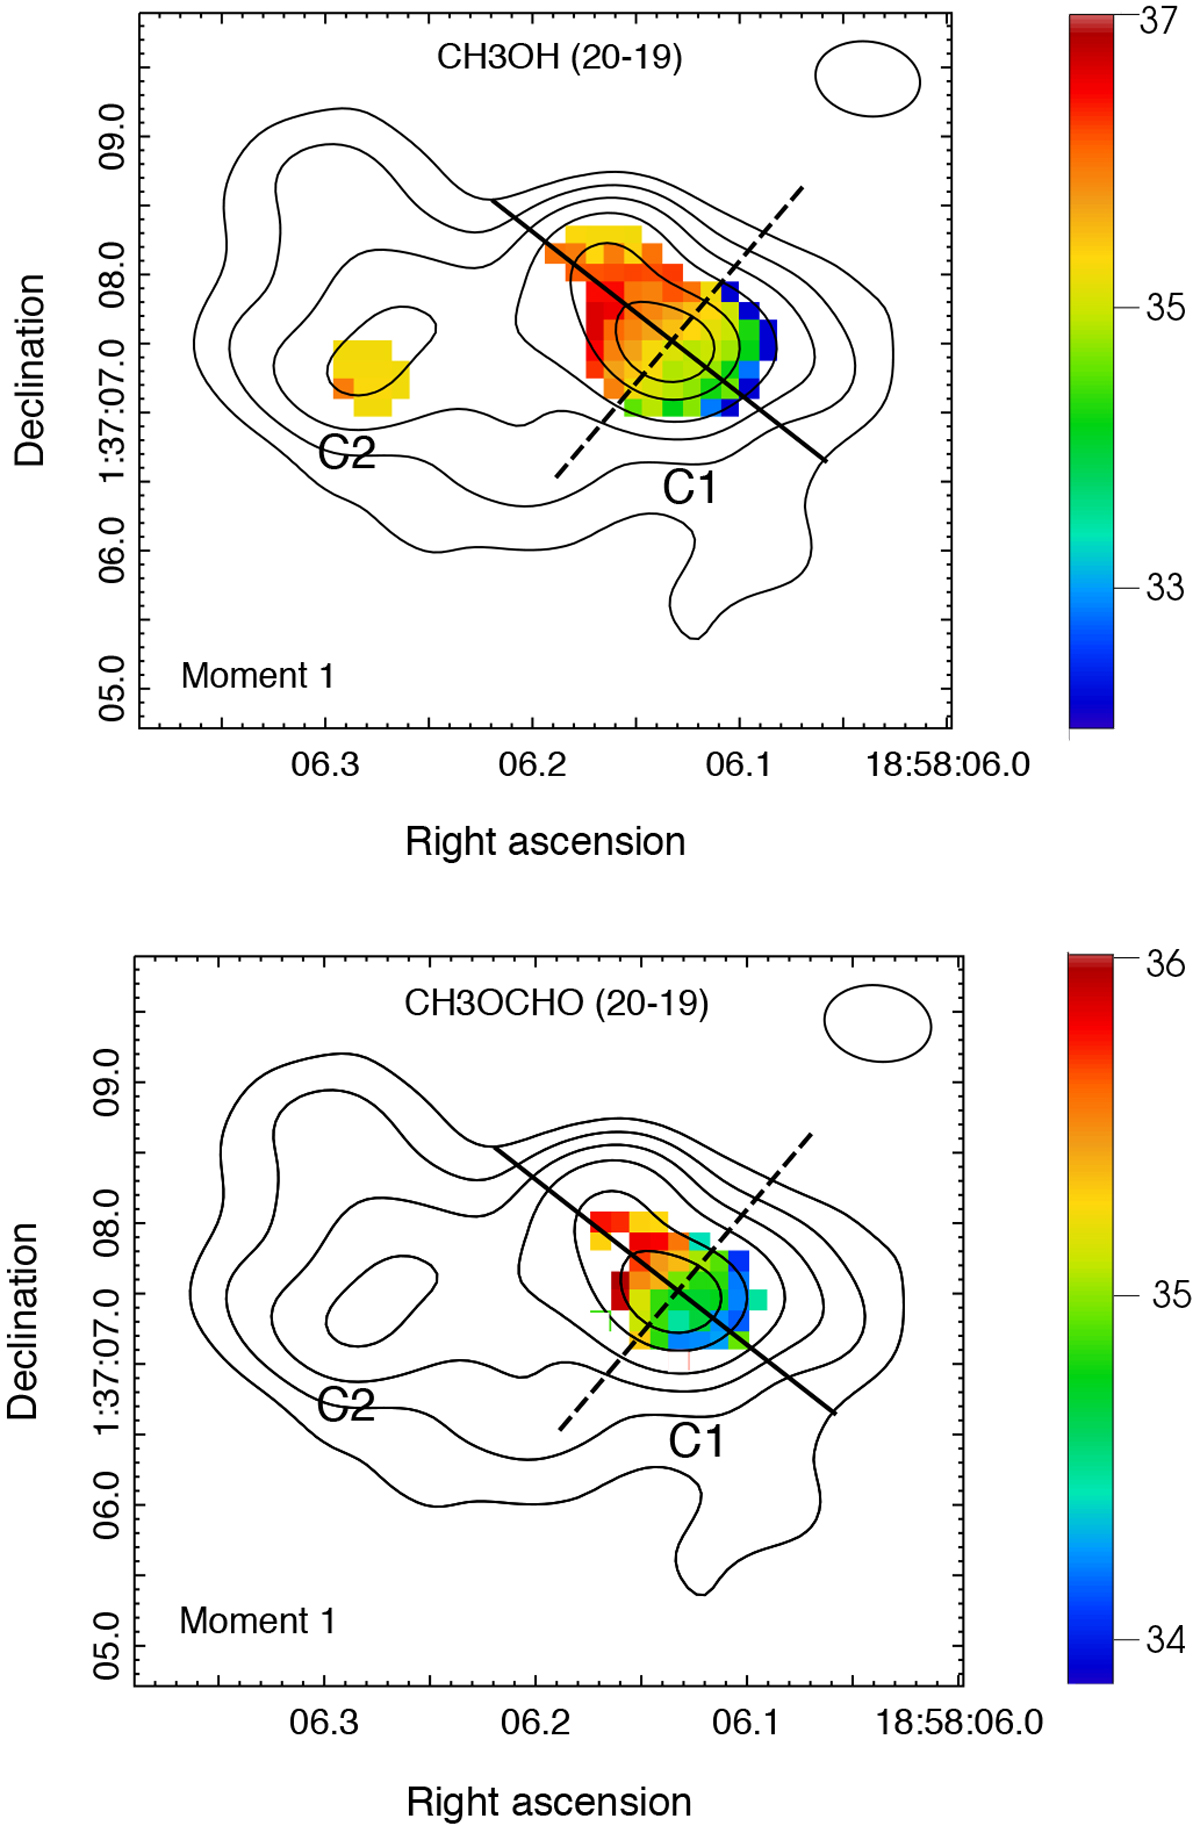
Moment 1 maps of the CH3OH 20(−2,19)–19(−3,17)E and CH3OCHO 20(1,19)–19(1,18) transitions. The color scale unit is km s−1. Black contours represent the continuum emission at 334 GHz. Levels are at 15, 30, 50, 80, 140, and 200 mJy beam−1. The beam isindicated in the top right corner of each panel. The solid and dashed lines show the approximated directions of the disk and its rotation axis, respectively.
Current usage metrics show cumulative count of Article Views (full-text article views including HTML views, PDF and ePub downloads, according to the available data) and Abstracts Views on Vision4Press platform.
Data correspond to usage on the plateform after 2015. The current usage metrics is available 48-96 hours after online publication and is updated daily on week days.
Initial download of the metrics may take a while.