Fig. 1
Download original image
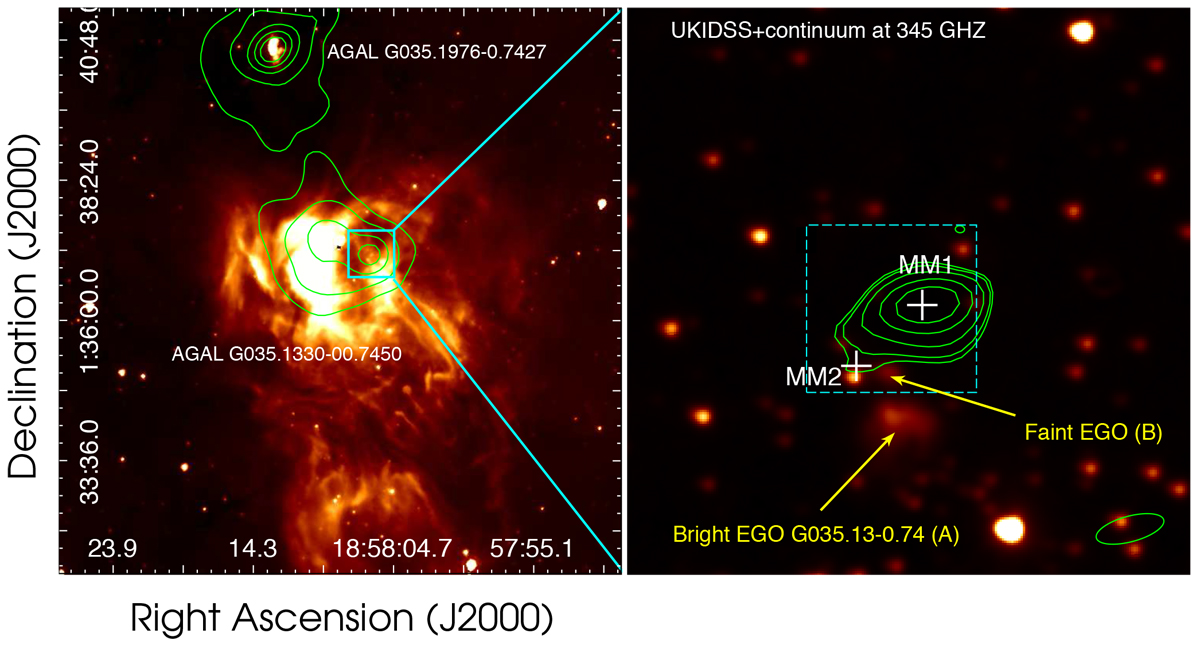
Overview of the H II region G035.126−00.755 at Spitzer-IRAC 8.0 μm image (left). The green contours represent the ATLASGAL emission at 870 μm. Levels are at 0.7, 1.2, 2.6, 4.5, and 7 Jy beam−1. Close-up view of the massive clump AGAL35 at UKIDSS K-band image (right). The green contours represent the ALMA continuum emission at 345 GHz (7 m array from Csengeri et al. 2017b). Levels are at 0.05, 0.10, 0.20, 0.35, and 0.50 Jy beam−1. The beam isindicated in the bottom right corner. The white crosses indicate the position of the two fragments found by Csengeri et al. (2017b) toward AGAL35. The dashed line square indicates the region we studied.
Current usage metrics show cumulative count of Article Views (full-text article views including HTML views, PDF and ePub downloads, according to the available data) and Abstracts Views on Vision4Press platform.
Data correspond to usage on the plateform after 2015. The current usage metrics is available 48-96 hours after online publication and is updated daily on week days.
Initial download of the metrics may take a while.