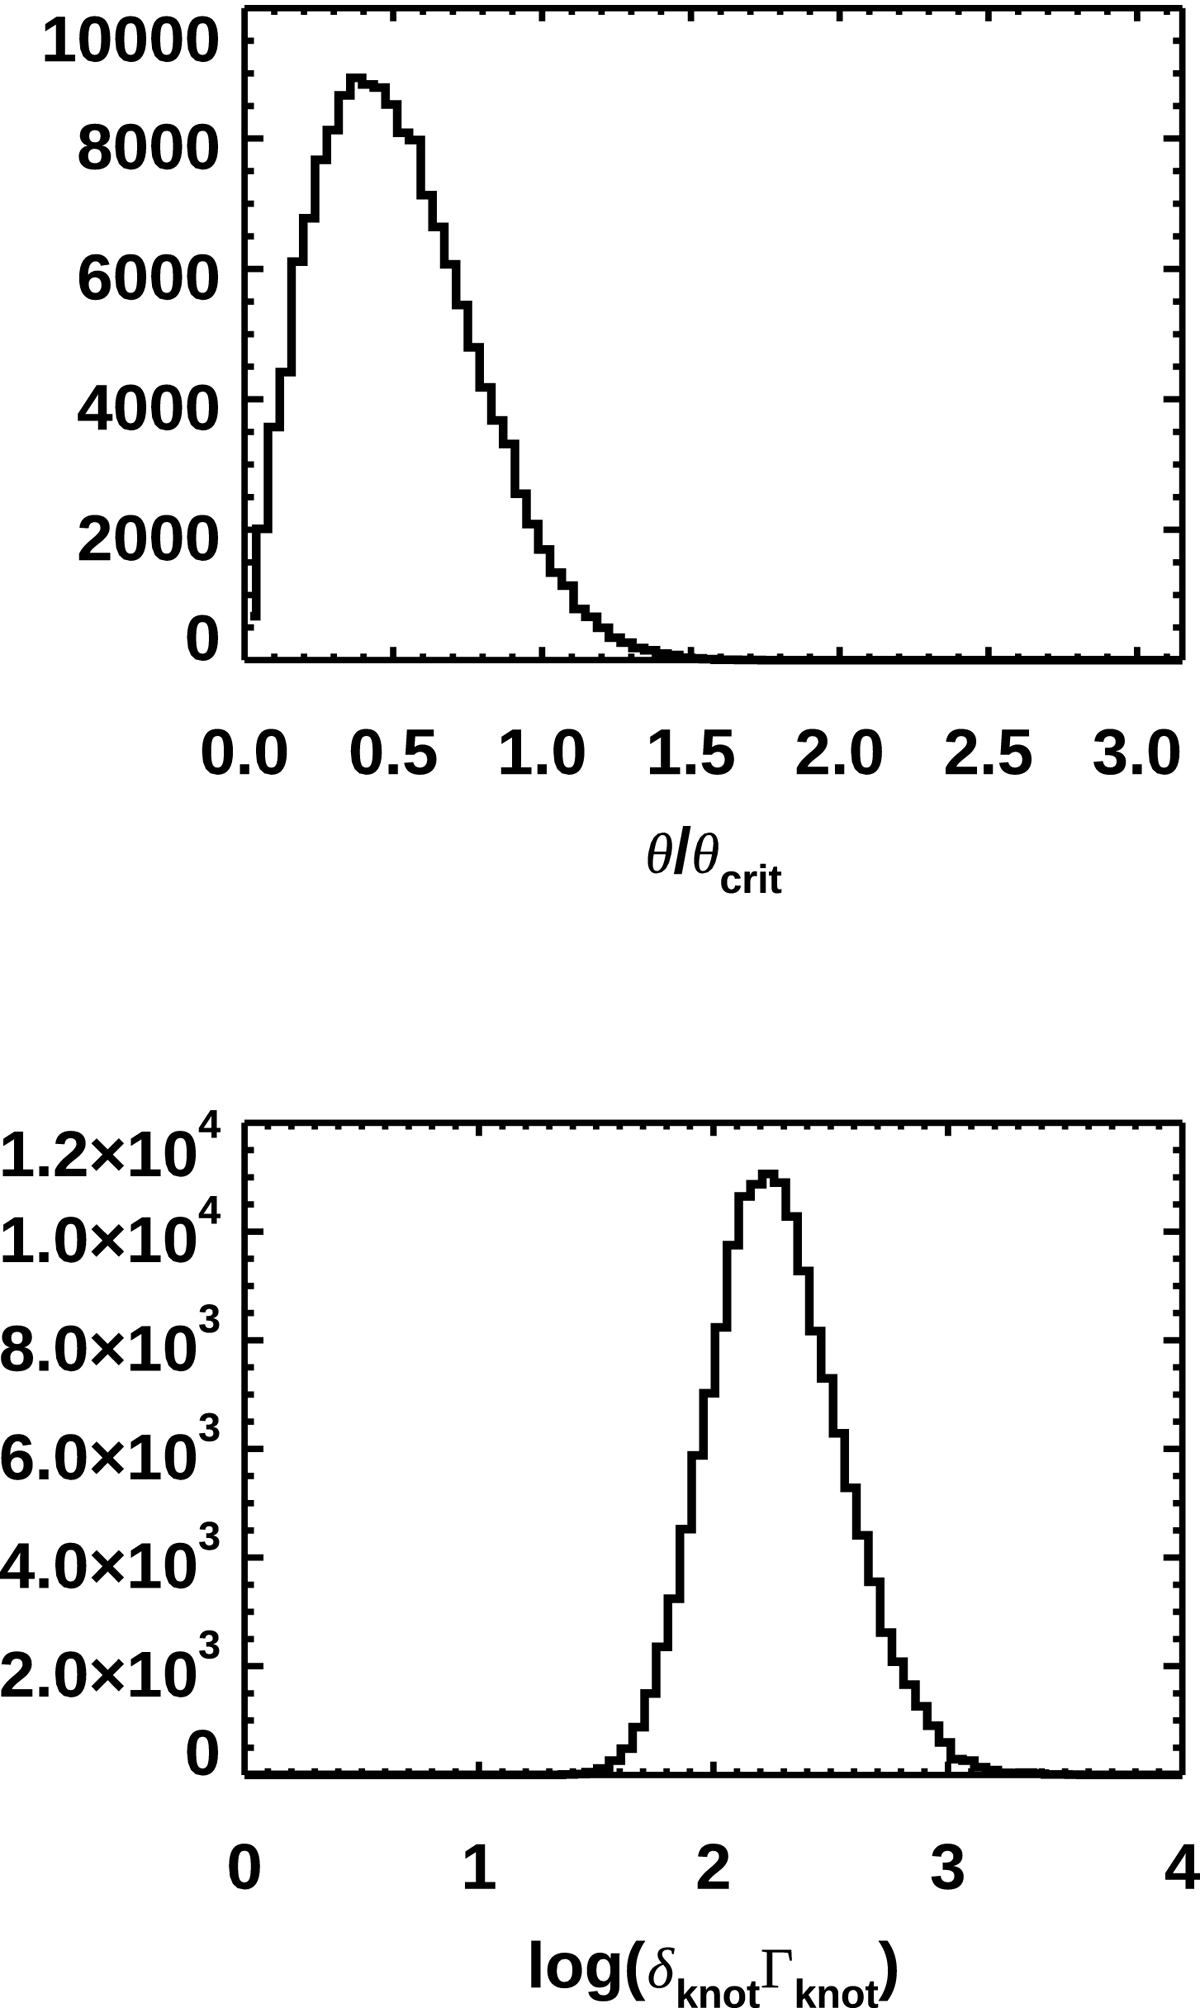
Fig. 8.
Download original image
Statistical distribution of relevant quantities obtained simulating case ccooling. To produce the histograms, the observer line of sight with respect to the jet axis was generated uniformly within a cone of aperture 30°. Top panel: distribution of viewing angles of gamma-ray detected flares. Bottom panel: distribution of Γknotδknot for gamma-ray detected flares.
Current usage metrics show cumulative count of Article Views (full-text article views including HTML views, PDF and ePub downloads, according to the available data) and Abstracts Views on Vision4Press platform.
Data correspond to usage on the plateform after 2015. The current usage metrics is available 48-96 hours after online publication and is updated daily on week days.
Initial download of the metrics may take a while.