Fig. 6.
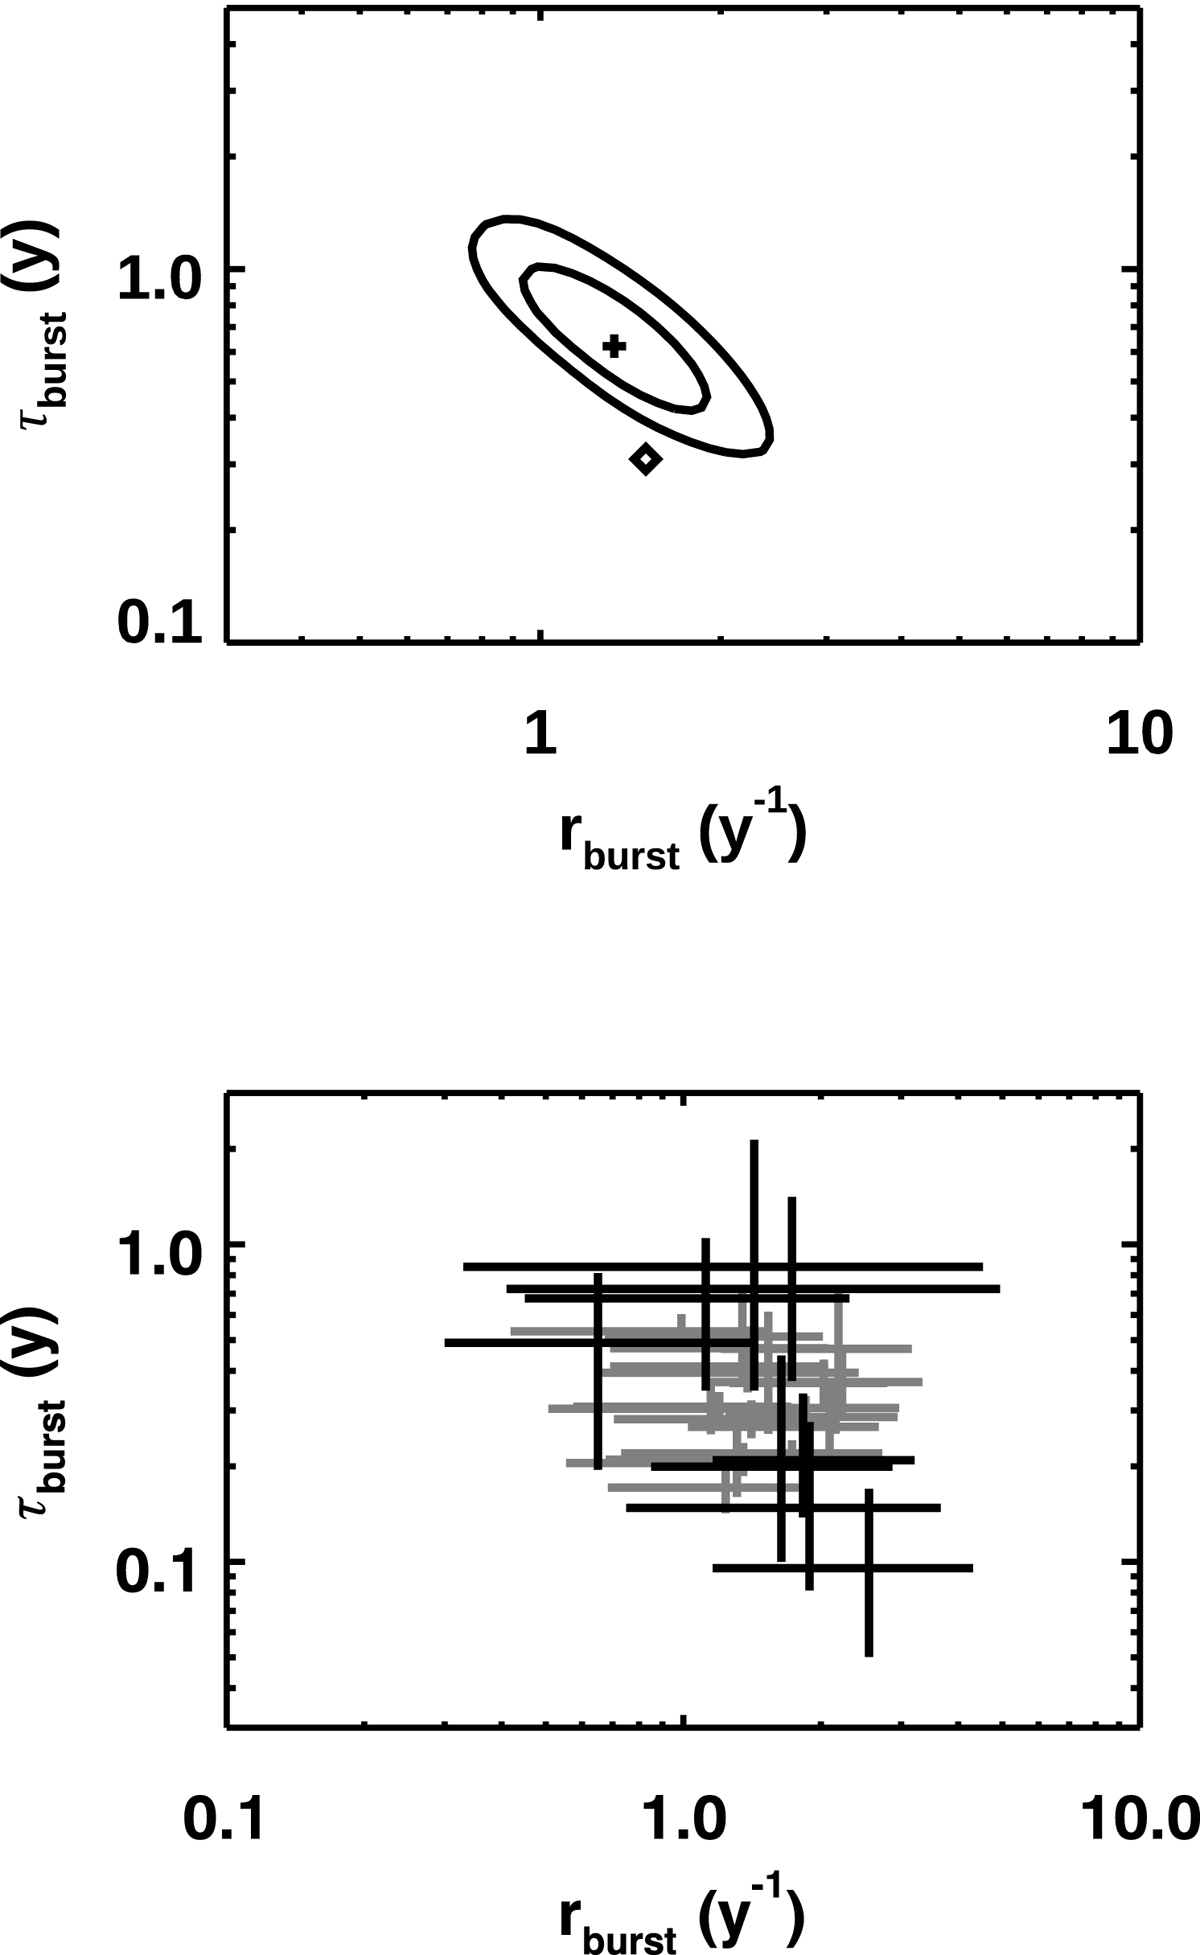
Download original image
Multi-loghat fit of the waiting times for the 100 MeV sample, and comparison with results reported in Jorstad et al. (2017). Top panel: joint confidence region for rburst and τburst (for the whole 100 MeV sample, excluding CTA 102). The parameters for the minimum of the Cash estimator are reported with a cross. Contours are reported for 90% and 99% confidence levels. The resolved superluminal features ejection rate and fading time observed at 43 GHz (Jorstad et al. 2017) are reported with a diamond symbol (average values). Bottom panel: rburst and τburst (in black) obtained by fitting the multi-loghat distribution to the data of single sources (for the apparently loudest sources in our gamma-ray sample). For comparison, the apparent ejection rate and fading times for each FSRQs reported in Jorstad et al. (2017) are also reported (in grey).
Current usage metrics show cumulative count of Article Views (full-text article views including HTML views, PDF and ePub downloads, according to the available data) and Abstracts Views on Vision4Press platform.
Data correspond to usage on the plateform after 2015. The current usage metrics is available 48-96 hours after online publication and is updated daily on week days.
Initial download of the metrics may take a while.