Fig. 7.
Download original image
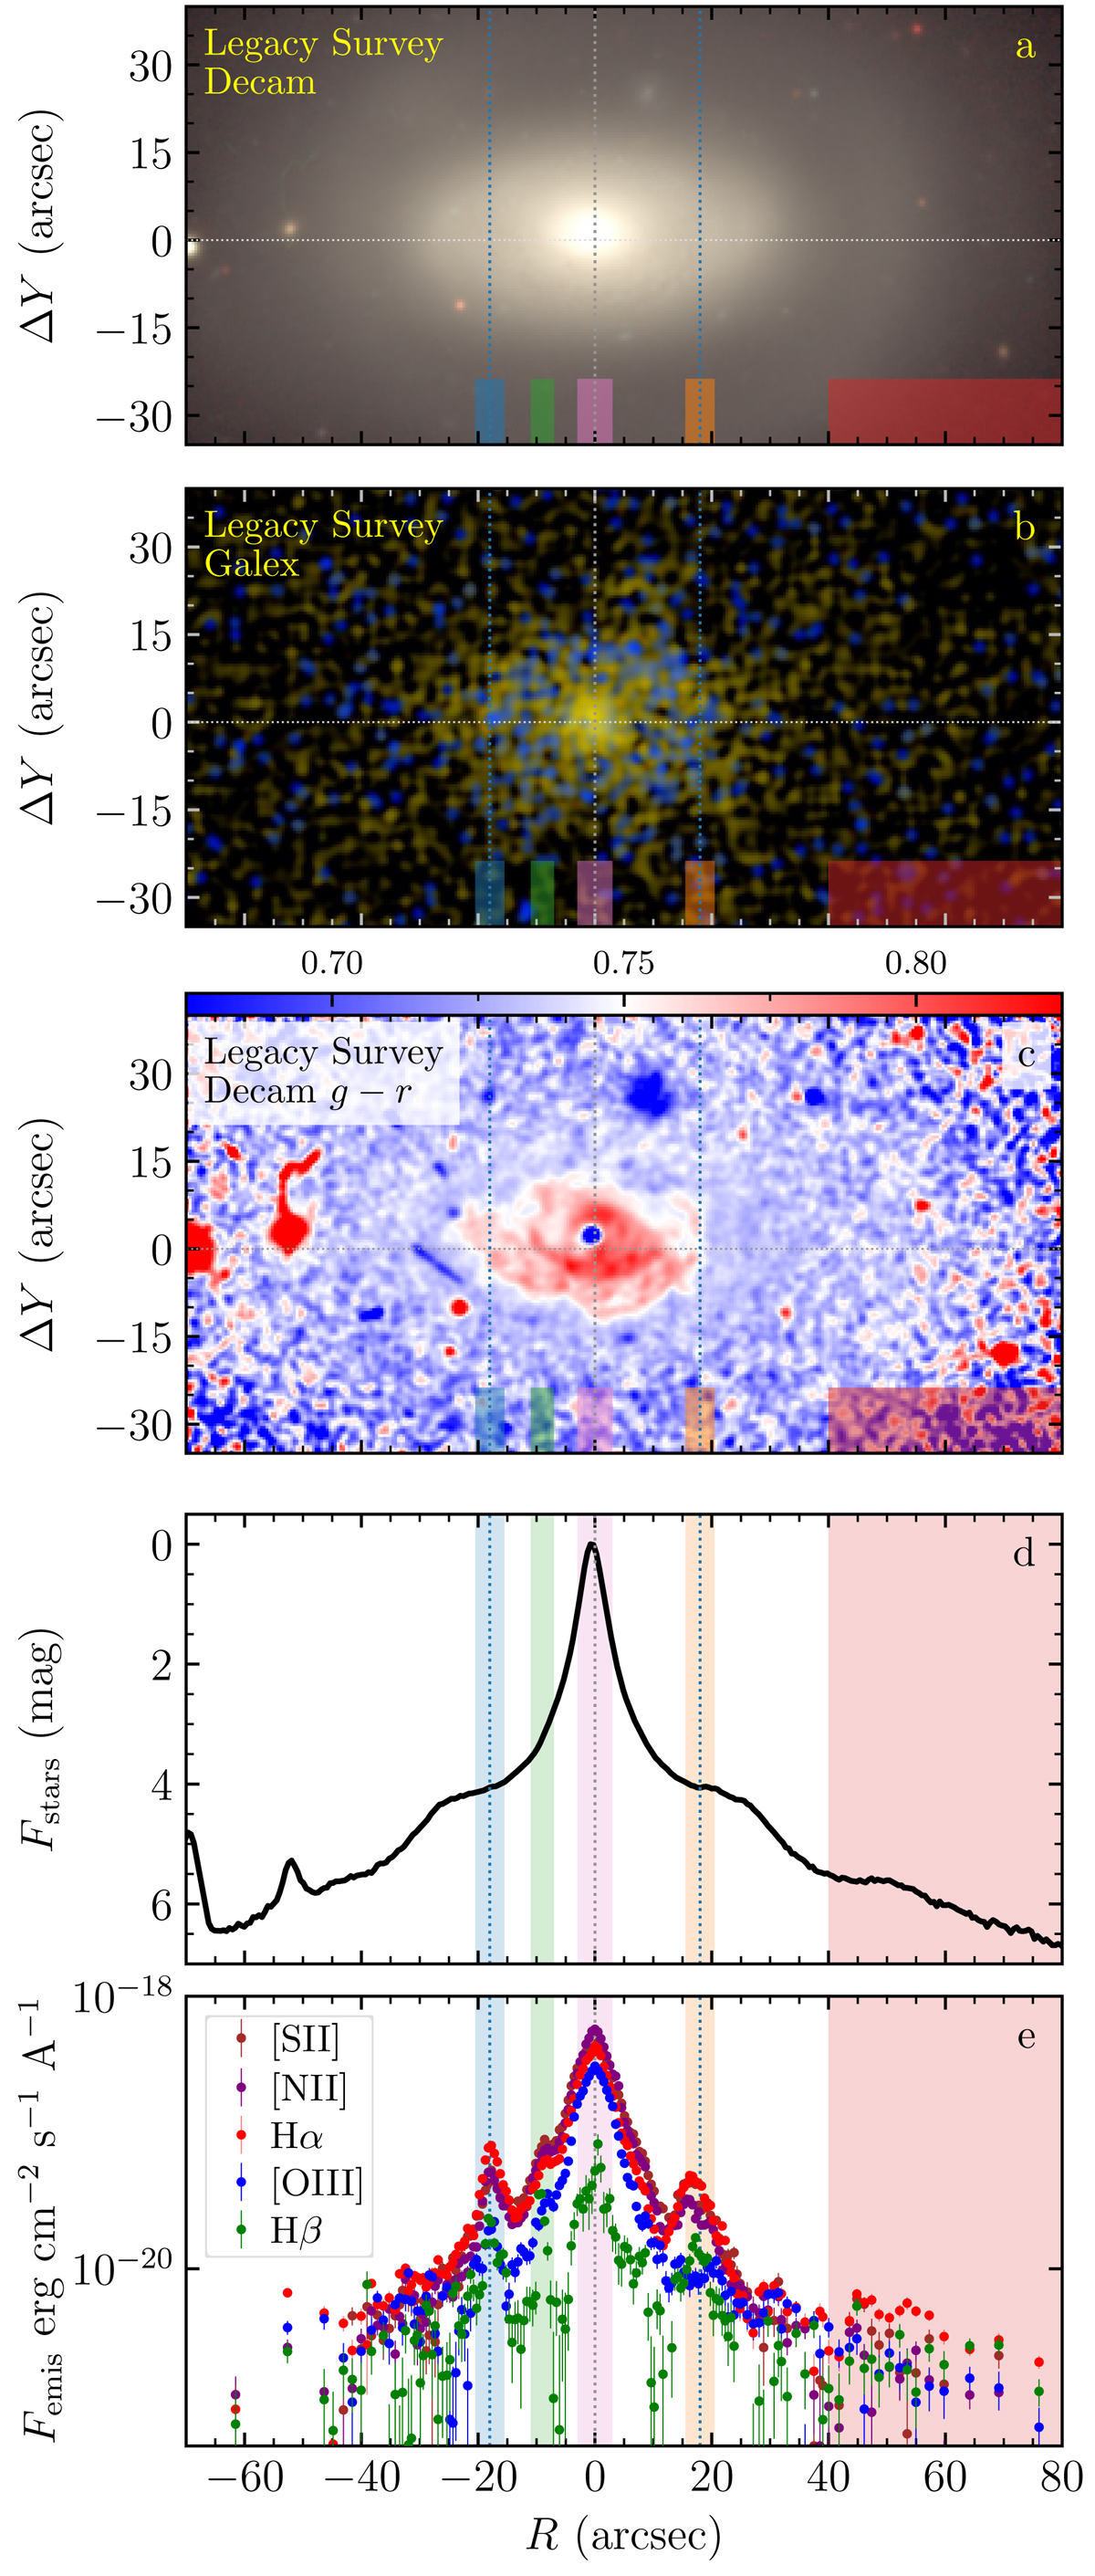
Comparison of imaging and spectral data. a: composite image built using grz DECaLS data. b: GALEX color image retrieved using the Legacy Survey cutout service. c: g − r color map constructed based on the DECaLS data. d: stellar continuum level at 5500 ± 20 Å in the rest frame along the slit. The zero point is chosen to have zero magnitude at the center of the galaxy. e: emission line fluxes recovered from the long-slit spectra. Color stripes are shown for reference and comparison with other figures and represent emission-line peaks at the inner star forming ring R = ±18″, external diffuse emission region at R = 45″ − 75″, and the galaxy nuclear and emission enhancement at R = −10″.
Current usage metrics show cumulative count of Article Views (full-text article views including HTML views, PDF and ePub downloads, according to the available data) and Abstracts Views on Vision4Press platform.
Data correspond to usage on the plateform after 2015. The current usage metrics is available 48-96 hours after online publication and is updated daily on week days.
Initial download of the metrics may take a while.