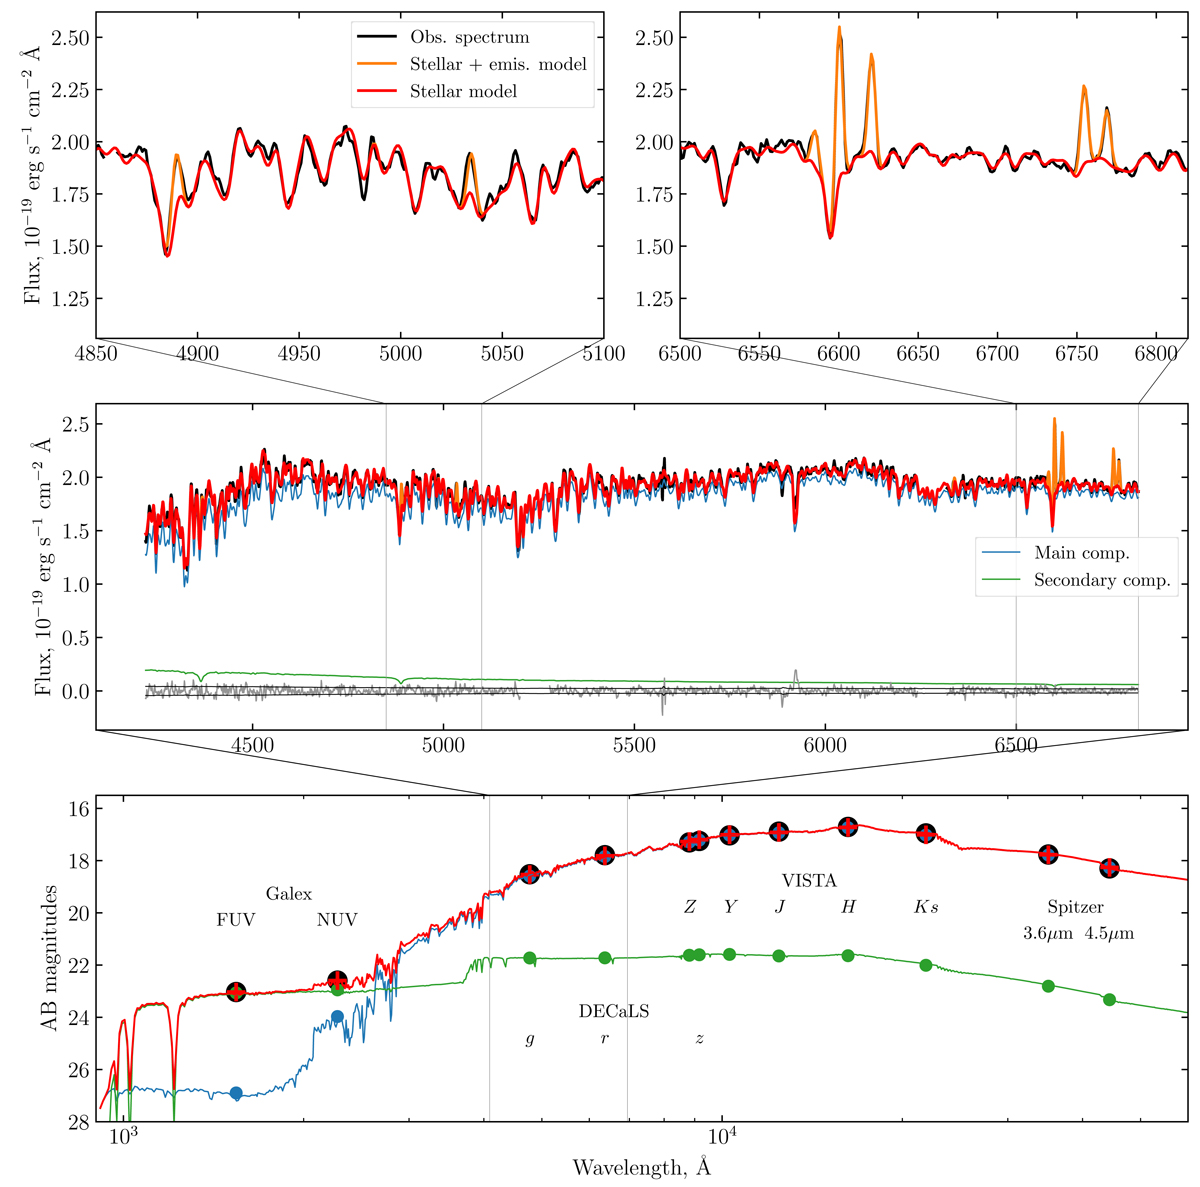
Fig. 6.
Download original image
Result of two-component spectro-photometric modeling of the spatial bin at R = +18 ± 3″. Middle and top panels: spectrum (black) and best-fit spectral model (red). Two stellar components of the model are shown in blue and green colors. Orange lines highlight the emission-line model. Residuals are presented in the mid panel in gray bordered by the error level (black lines). Bottom panel: SED part of the model. Observed magnitudes are shown in large black circles, and the best-fit SED model is shown with red crosses. Blue and green circles correspond to SED models of individual components whose low-resolution spectra are shown by colored lines.
Current usage metrics show cumulative count of Article Views (full-text article views including HTML views, PDF and ePub downloads, according to the available data) and Abstracts Views on Vision4Press platform.
Data correspond to usage on the plateform after 2015. The current usage metrics is available 48-96 hours after online publication and is updated daily on week days.
Initial download of the metrics may take a while.