Fig. 4.
Download original image
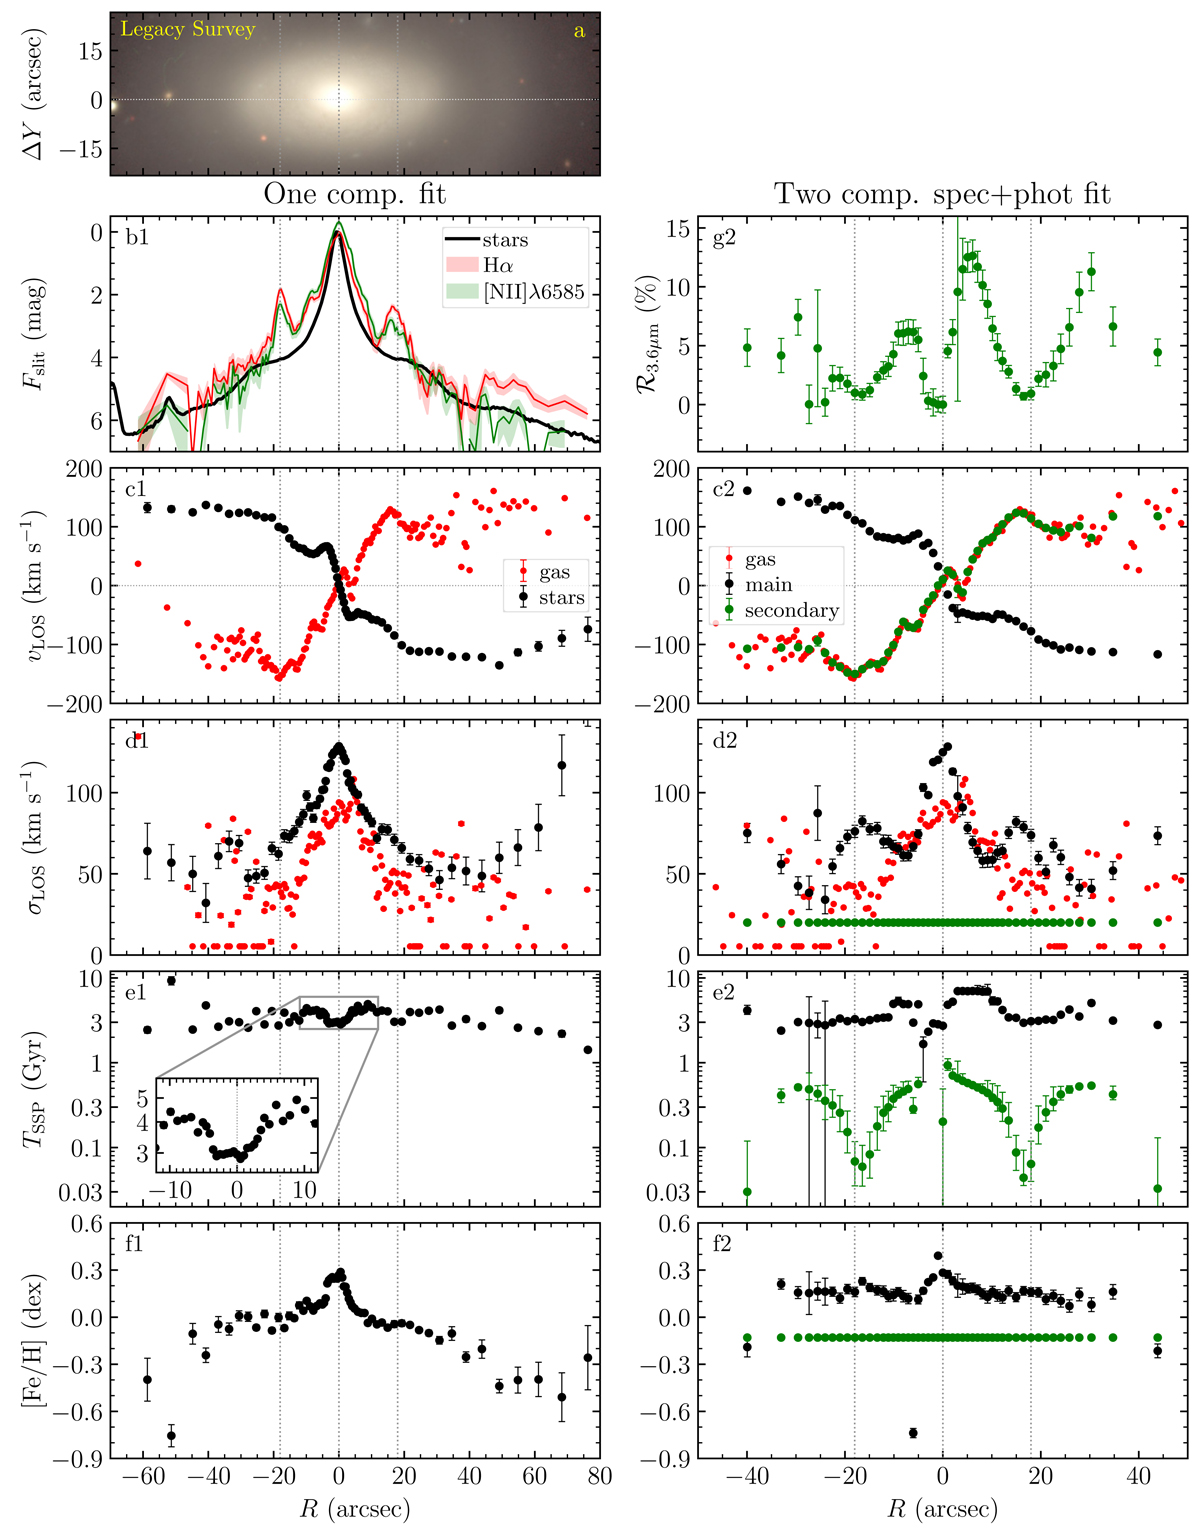
Results of spectrum fitting. The first column shows the result of a one-component fitting of the optical spectrum only (Sect. 3.2), while the second column deals with a two-component spectro-photometrical fitting (Sect. 3.3.2). a: reference composite image manually built using g, r, and z-band data from DECaLS survey to avoid a saturated galaxy center. b1: stellar continuum level at 5500 ± 20 Å in the rest frame along the slit (black line) and Hα and [N II] fluxes (colored lines). For illustrative purposes, the stellar and emission-line profiles are converted to magnitudes assuming zero magnitude in the center. c1, c2: stellar and ionized gas line-of-sight velocity profiles. d1, d2: stellar and ionized gas line-of-sight velocity dispersion profiles. e1, e2: SSP-equivalent age. f1, f2: stellar metallicity. g2: relative contribution of secondary component to 3.6 μm band. The black and green symbols in panels c2, d2, e2, and f2 show the parameters of the main and secondary stellar components in the spectro-photometric modeling. The vertical gray lines at R = ±18″ correspond to the inner star forming ring.
Current usage metrics show cumulative count of Article Views (full-text article views including HTML views, PDF and ePub downloads, according to the available data) and Abstracts Views on Vision4Press platform.
Data correspond to usage on the plateform after 2015. The current usage metrics is available 48-96 hours after online publication and is updated daily on week days.
Initial download of the metrics may take a while.