Fig. 9
Download original image
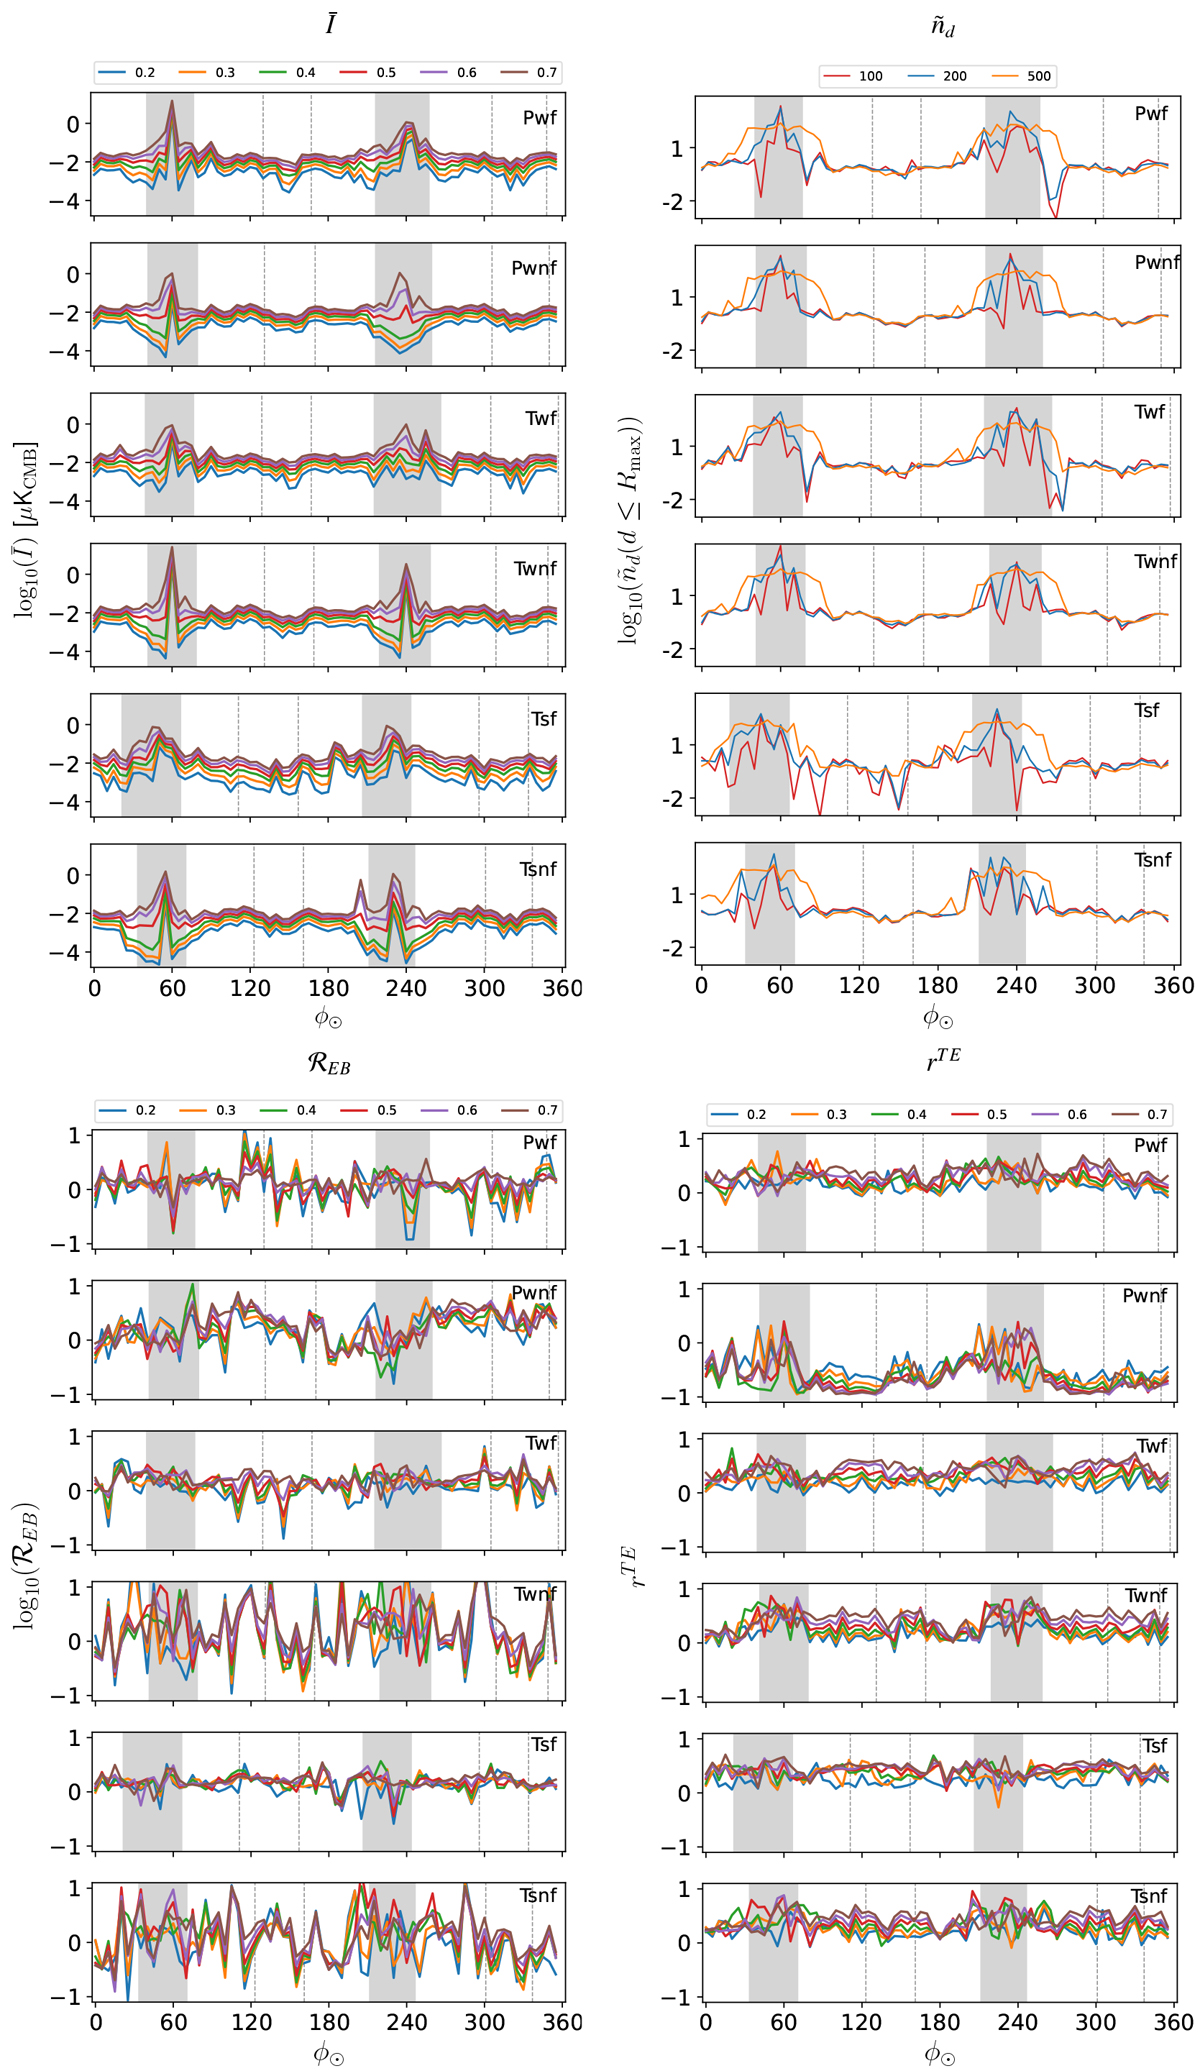
Variations of the averaged weighted emission intensity (Ī) (top left), ![]() (bottom left) and rTE (bottom right) as a function of the azimuthal position of the observer (ϕ⊙ [°]) for the different galaxies (indicated in the captions) and for different values of sky fraction (fsky, indicated by the colors in the legend). Top right: evolution of the averaged dust density (normalized to the sample median) in spheres of radii (100 pc, 200 pc and 500 pc) around an observer as a function its azimuthal coordinate (ϕ⊙). The colors represent different values of the radius of the sphere surrounding the observer as informed by the legend. Spheres are independent if their ϕ⊙ differ by at least 1.43°, 2.86° and 7.16° for radius Rsph of 100 pc, 200 pc, and 500 pc, respectively. The vertical gray bands indicate the range of ϕ⊙ values in which we consider the observer to be located in the arms (see Sect. 4.4.1).
(bottom left) and rTE (bottom right) as a function of the azimuthal position of the observer (ϕ⊙ [°]) for the different galaxies (indicated in the captions) and for different values of sky fraction (fsky, indicated by the colors in the legend). Top right: evolution of the averaged dust density (normalized to the sample median) in spheres of radii (100 pc, 200 pc and 500 pc) around an observer as a function its azimuthal coordinate (ϕ⊙). The colors represent different values of the radius of the sphere surrounding the observer as informed by the legend. Spheres are independent if their ϕ⊙ differ by at least 1.43°, 2.86° and 7.16° for radius Rsph of 100 pc, 200 pc, and 500 pc, respectively. The vertical gray bands indicate the range of ϕ⊙ values in which we consider the observer to be located in the arms (see Sect. 4.4.1).
Current usage metrics show cumulative count of Article Views (full-text article views including HTML views, PDF and ePub downloads, according to the available data) and Abstracts Views on Vision4Press platform.
Data correspond to usage on the plateform after 2015. The current usage metrics is available 48-96 hours after online publication and is updated daily on week days.
Initial download of the metrics may take a while.