Fig. 8
Download original image
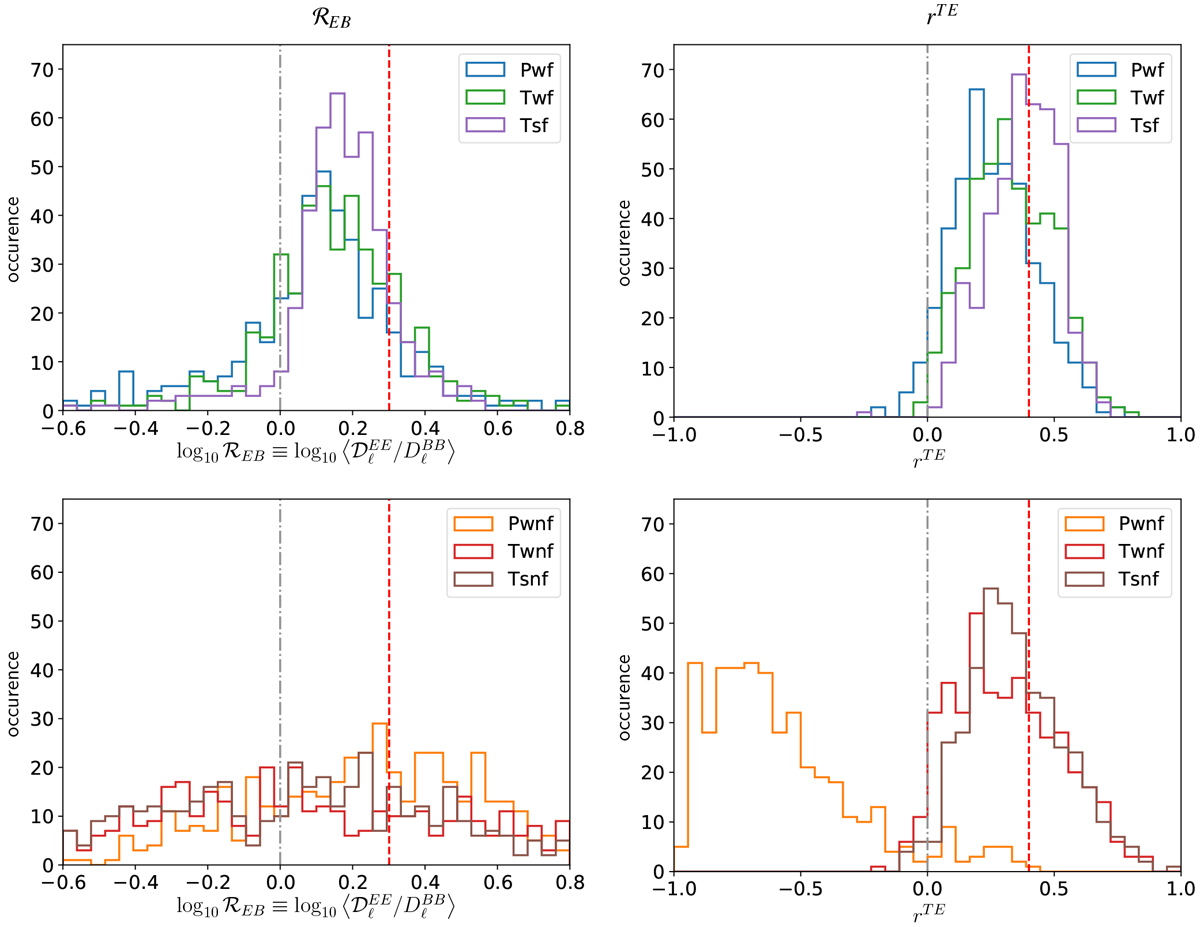
Histograms of ![]() (left) and rTE
(right) as measured on polarization maps synthesized from the three models with feedback (top) and without feedback (bottom). Power spectra corresponding to all values of
fsky are put together, making an ensemble of 432 measurements per galaxy setup. The vertical gray dot-dashed (red dashed) lines mark the values of
(left) and rTE
(right) as measured on polarization maps synthesized from the three models with feedback (top) and without feedback (bottom). Power spectra corresponding to all values of
fsky are put together, making an ensemble of 432 measurements per galaxy setup. The vertical gray dot-dashed (red dashed) lines mark the values of ![]() (2) on the left and of rTE = 0 (0.4) on the right, for reference.
(2) on the left and of rTE = 0 (0.4) on the right, for reference.
Current usage metrics show cumulative count of Article Views (full-text article views including HTML views, PDF and ePub downloads, according to the available data) and Abstracts Views on Vision4Press platform.
Data correspond to usage on the plateform after 2015. The current usage metrics is available 48-96 hours after online publication and is updated daily on week days.
Initial download of the metrics may take a while.