Fig. 5
Download original image
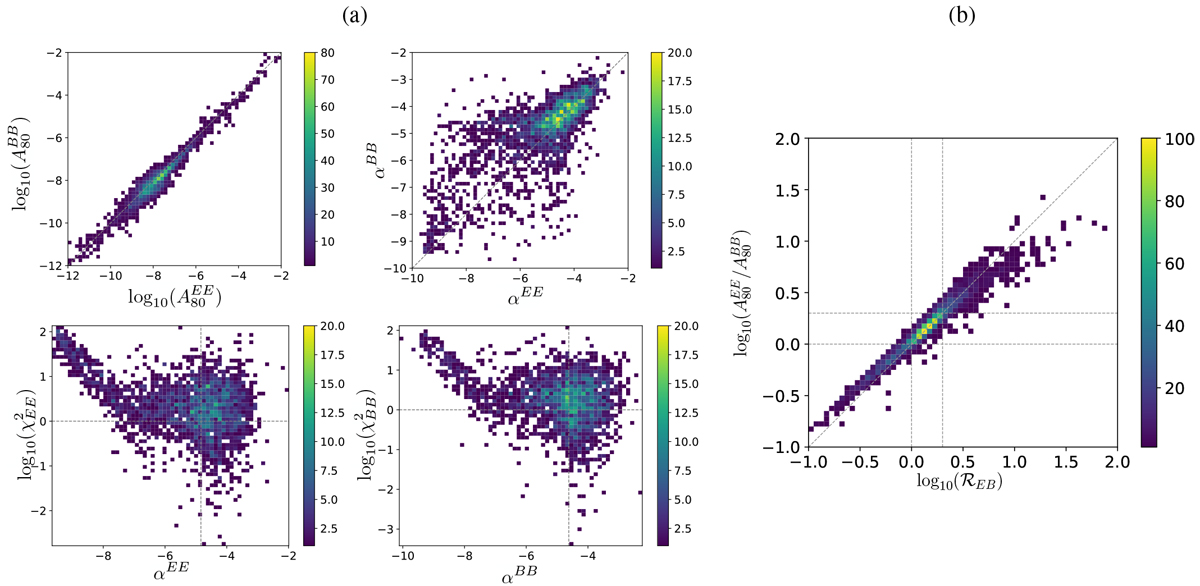
2D histograms of combinations of parameters from power-law fits used to characterize the shape of the power spectra for the full sample; all galaxy setups, observer position and sky fractions merged together. Panel a: from top left to bottom right we have
![]() ,
(αEE, αBB),
,
(αEE, αBB),
![]() and
and ![]() . The main diagonals are shown in top panels for reference. In the bottom panels the horizontal lines mark values of
. The main diagonals are shown in top panels for reference. In the bottom panels the horizontal lines mark values of
![]() and the vertical lines show the median of the spectral indices. Panel b:
and the vertical lines show the median of the spectral indices. Panel b:
![]() versus
versus ![]() . The horizontal and vertical lines mark ratio values of 1 and 2 and are given for visual reference. The main diagonal is also shown.
. The horizontal and vertical lines mark ratio values of 1 and 2 and are given for visual reference. The main diagonal is also shown.
Current usage metrics show cumulative count of Article Views (full-text article views including HTML views, PDF and ePub downloads, according to the available data) and Abstracts Views on Vision4Press platform.
Data correspond to usage on the plateform after 2015. The current usage metrics is available 48-96 hours after online publication and is updated daily on week days.
Initial download of the metrics may take a while.