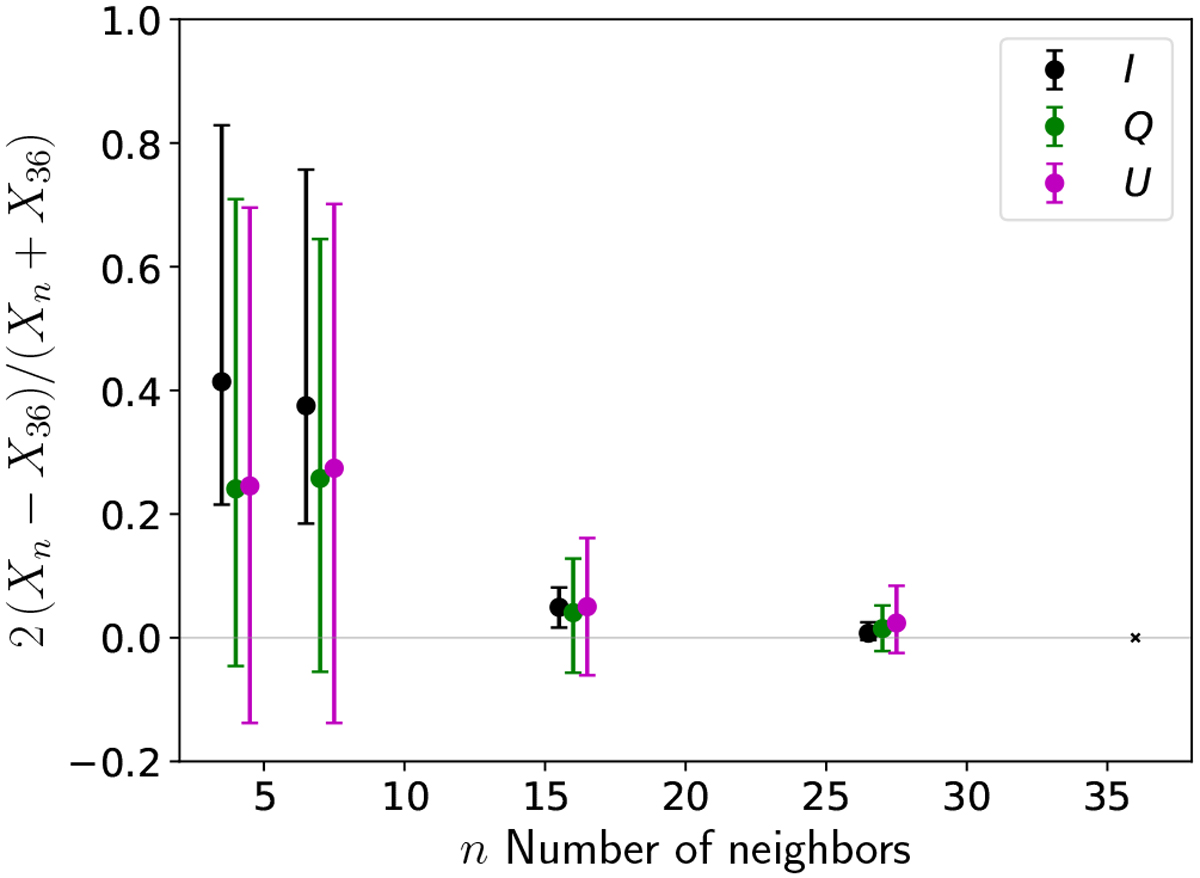
Fig. C.1
Download original image
Summarizing statistics of the relative differences between maps obtained using n neighbors in the interpolation scheme and n =36. For each value of n we show themedian of the relative differences and the error bars are such that they contain 68 per cent of the data. The observables (X) are shown as indicated by the legend. We slightly shift horizontally the values for I and U for a better visualization.
Current usage metrics show cumulative count of Article Views (full-text article views including HTML views, PDF and ePub downloads, according to the available data) and Abstracts Views on Vision4Press platform.
Data correspond to usage on the plateform after 2015. The current usage metrics is available 48-96 hours after online publication and is updated daily on week days.
Initial download of the metrics may take a while.