Fig. 10
Download original image
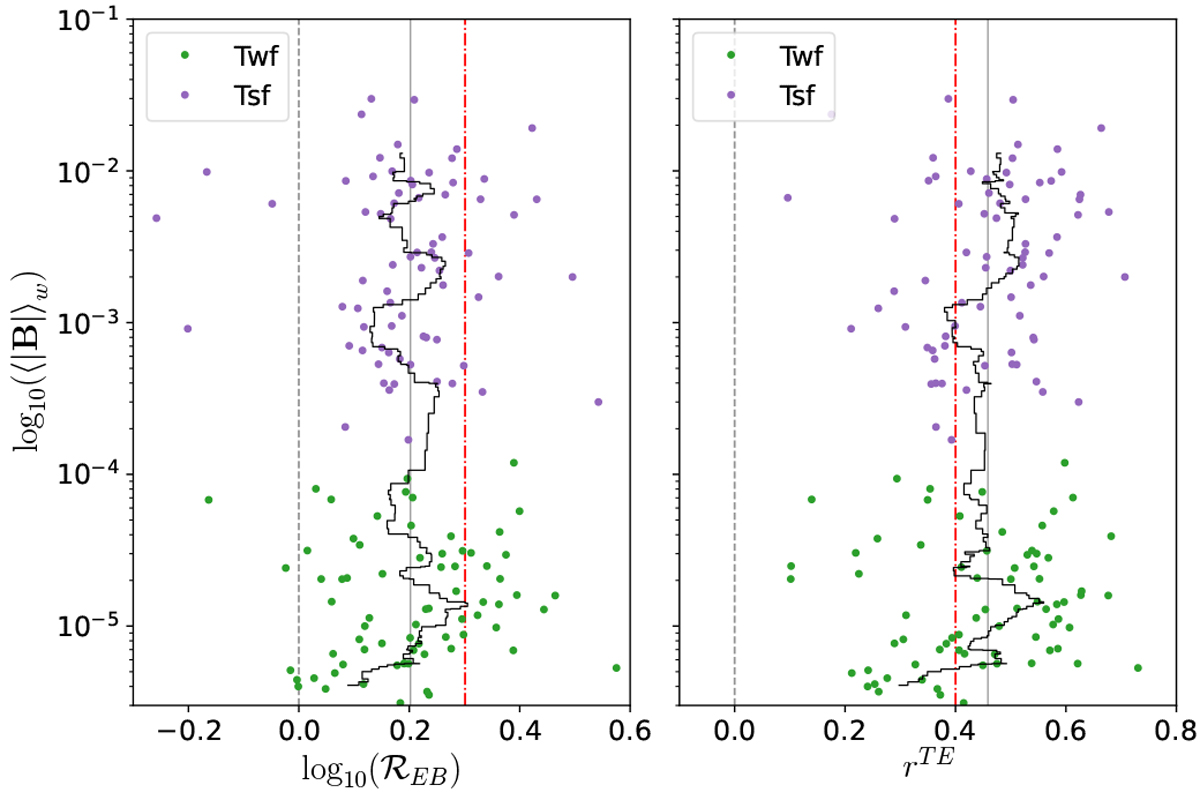
Scatter plots of strength of the local magnetic field (in μG) versus ![]() (left) and rTE, measured from the Twf (green) and Tsf (purple) galaxies for fsky = 0.7. The strength of the field is the volume-weighed average of the field of all cells having their centers within a sphere radius of 500 pc centered on the observer. Gray and red vertical lines are the same as in Fig. 8. The gray tine solid line show the medians of the data points and the shacked black lines show running means along
|B | considering 10 data points at a time.
(left) and rTE, measured from the Twf (green) and Tsf (purple) galaxies for fsky = 0.7. The strength of the field is the volume-weighed average of the field of all cells having their centers within a sphere radius of 500 pc centered on the observer. Gray and red vertical lines are the same as in Fig. 8. The gray tine solid line show the medians of the data points and the shacked black lines show running means along
|B | considering 10 data points at a time.
Current usage metrics show cumulative count of Article Views (full-text article views including HTML views, PDF and ePub downloads, according to the available data) and Abstracts Views on Vision4Press platform.
Data correspond to usage on the plateform after 2015. The current usage metrics is available 48-96 hours after online publication and is updated daily on week days.
Initial download of the metrics may take a while.