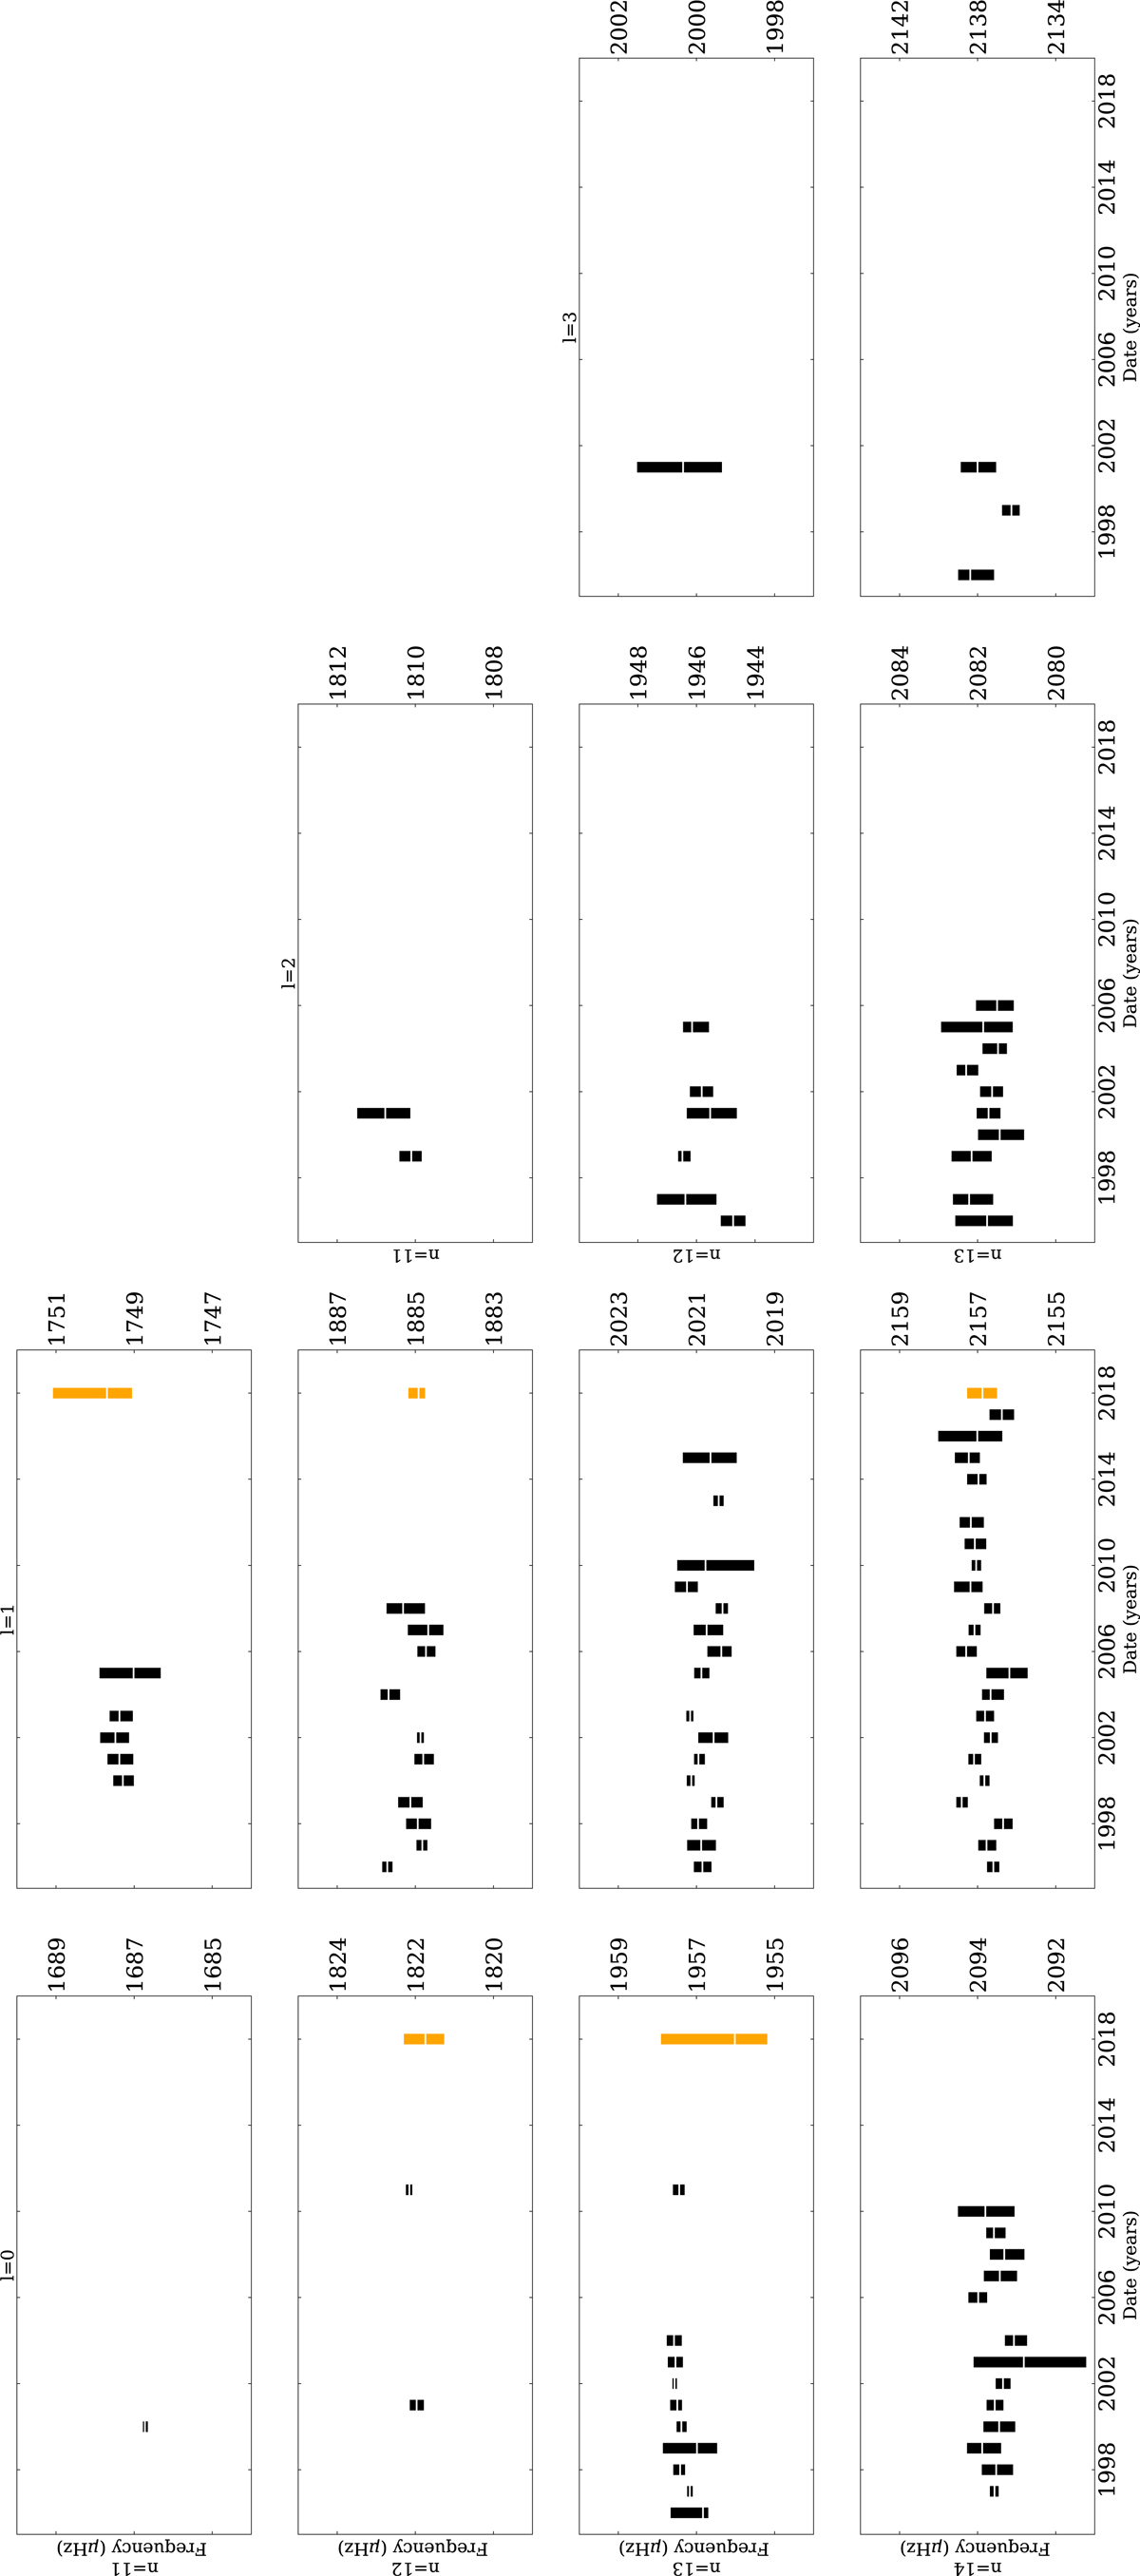
Fig. 14.
Download original image
Fitted mode frequencies and uncertainties for yearly GOLF 30-day series (black). The uncertainties on mode frequencies fitted within the Solar-SONG spectrum are represented in orange for the purpose of comparison. The white tick signals the median value of the fitted distribution. For both instruments, only modes with an uncertainty below 2 μHz are represented.
Current usage metrics show cumulative count of Article Views (full-text article views including HTML views, PDF and ePub downloads, according to the available data) and Abstracts Views on Vision4Press platform.
Data correspond to usage on the plateform after 2015. The current usage metrics is available 48-96 hours after online publication and is updated daily on week days.
Initial download of the metrics may take a while.