Free Access
Fig. 9.
Download original image
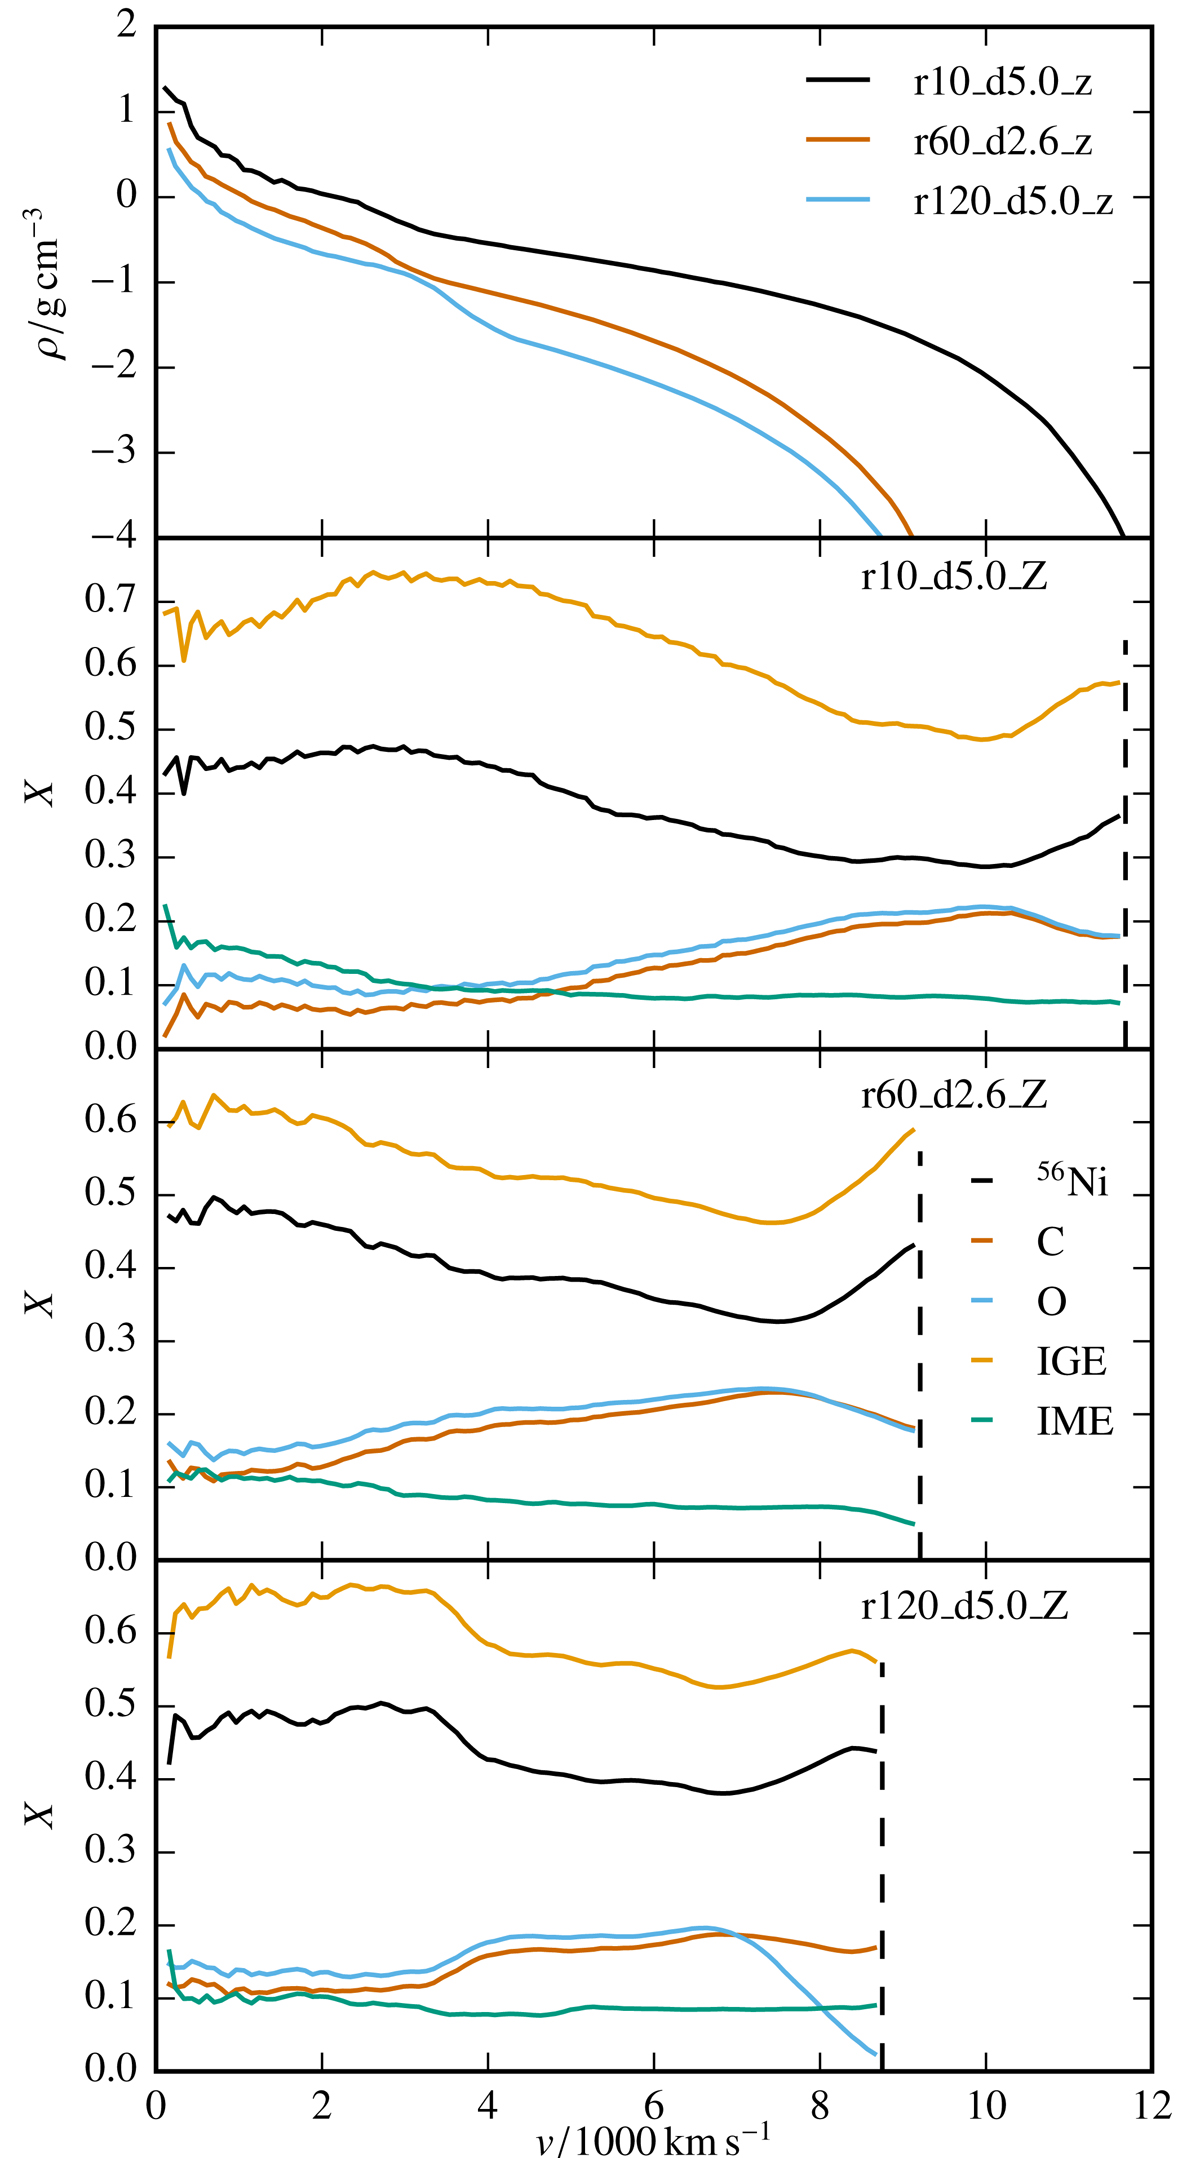
1D averaged density profile of the ejecta for Models r10_5.0_Z, r60_2.6_Z, r120_5.0_Z (upper panel). Lower three panels: 1D IGE, 56Ni, IME, C, and O profiles for the respective models. The dashed lines indicate a cutoff at densities below 10−4 g cm−3.
Current usage metrics show cumulative count of Article Views (full-text article views including HTML views, PDF and ePub downloads, according to the available data) and Abstracts Views on Vision4Press platform.
Data correspond to usage on the plateform after 2015. The current usage metrics is available 48-96 hours after online publication and is updated daily on week days.
Initial download of the metrics may take a while.