Fig. 14.
Download original image
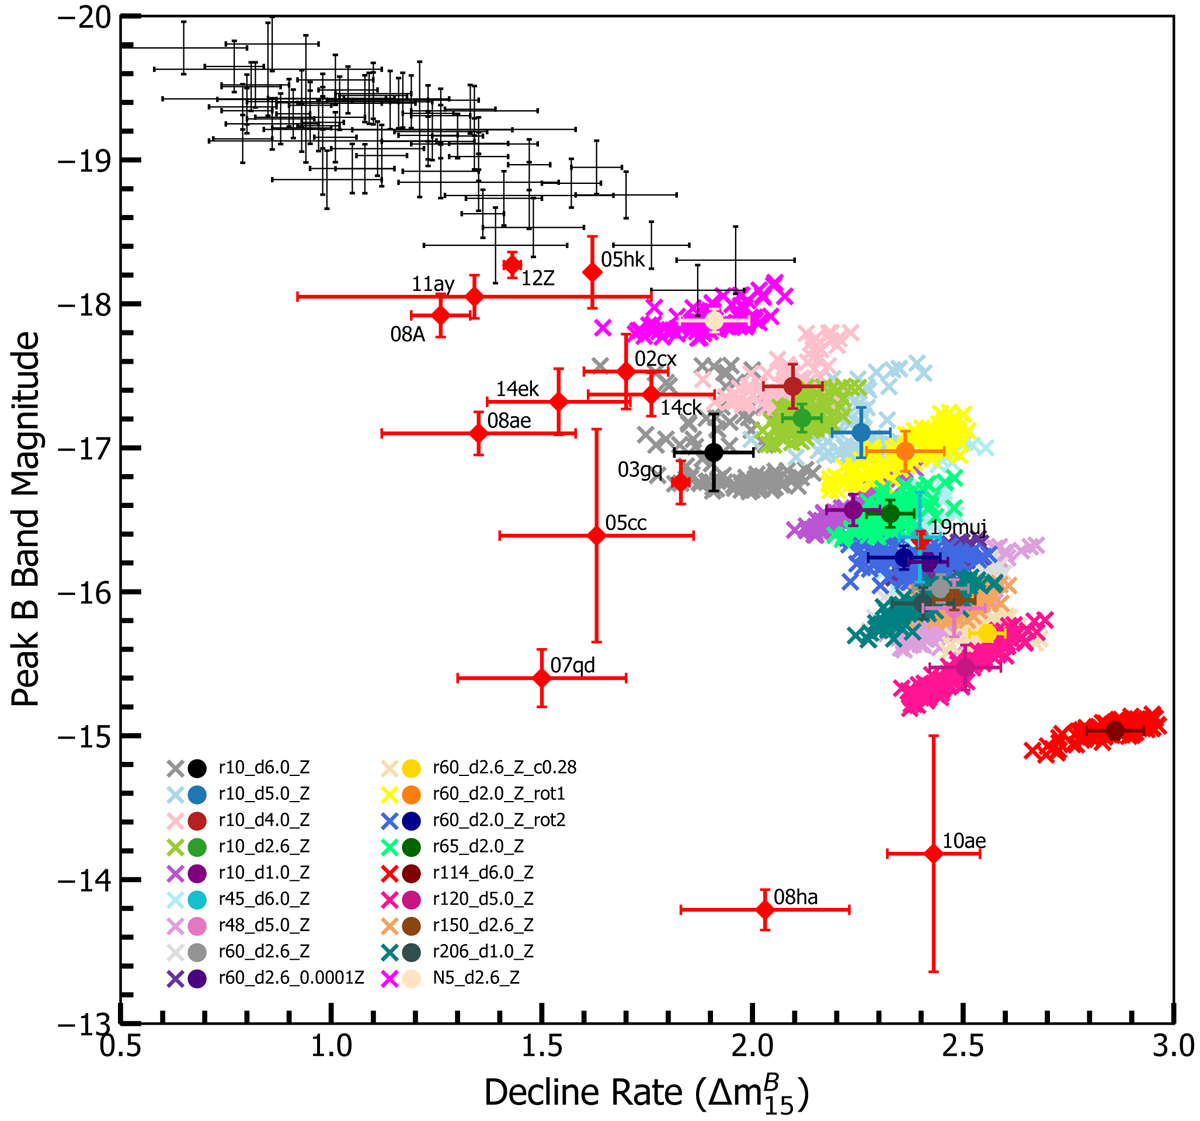
B-band magnitude vs. ![]() plotted in the same way as in Fig. 13. Also included is data compiled by Taubenberger (2017): normal SNe Ia are shown as black crosses and SNe Iax (as in Fig. 13) are labeled by name and represented by red diamonds. Additional SNe Iax have also been added: SN 2014ck, SN 2019muj (see Fig. 13 for references), and SN 2014ek (Li et al. 2018). B-band is chosen as viewing angle effects are easier to identify in the blue bands.
plotted in the same way as in Fig. 13. Also included is data compiled by Taubenberger (2017): normal SNe Ia are shown as black crosses and SNe Iax (as in Fig. 13) are labeled by name and represented by red diamonds. Additional SNe Iax have also been added: SN 2014ck, SN 2019muj (see Fig. 13 for references), and SN 2014ek (Li et al. 2018). B-band is chosen as viewing angle effects are easier to identify in the blue bands.
Current usage metrics show cumulative count of Article Views (full-text article views including HTML views, PDF and ePub downloads, according to the available data) and Abstracts Views on Vision4Press platform.
Data correspond to usage on the plateform after 2015. The current usage metrics is available 48-96 hours after online publication and is updated daily on week days.
Initial download of the metrics may take a while.