Fig. 13.
Download original image
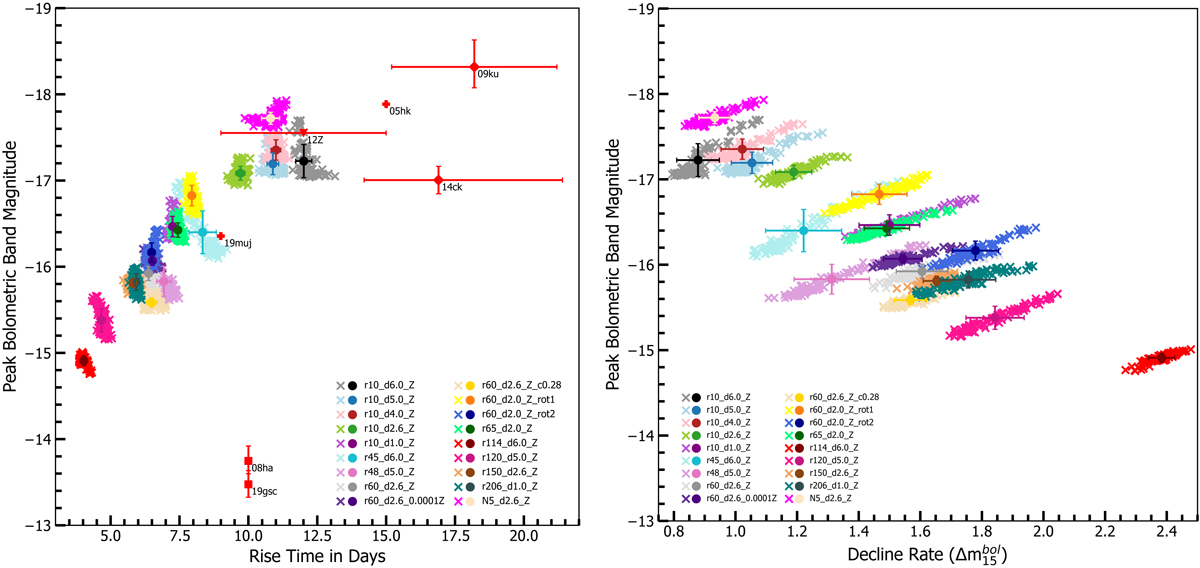
Viewing angle dependencies of the bolometric light curveproperties for selected models. The solid circles represent the angle-averaged values and the crosses represent values from 100 different viewing angles for each model. The error bars depict the standard deviation of the viewing angle distribution for each model. Left panel: the peak bolometric-band magnitude is plotted against rise time. Alongside the models, estimates of peak bolometric magnitude and rise times for the observed SNe Iax SN 2019gsc (Srivastav et al. 2020, taking the values calculated for their full blackbody bolometric light curve), SN 2008ha (Foley et al. 2009), SN 2019muj (Barna et al. 2021), SN 2014ck (Tomasella et al. 2016), SN 2012Z (Yamanaka et al. 2015), SN 2005hk (Phillips et al. 2007), and SN 2009ku (Narayan et al. 2011) are included (represented by red markers and labeled by name). The different marker styles representing the SNe Iax of diamond, square, triangle, and plus correspond to SNe Iax where errors were quoted for both rise time and peak bolometric magnitude, only for peak bolometric magnitude, only for rise time and no errors quoted respectively. Where uncertainties were not quoted the uncertainties are still significant, particularly in rise times that can have uncertainties as much as several days. Right hand panel: peak bolometric-band magnitude vs. decline rate in terms of ![]() .
.
Current usage metrics show cumulative count of Article Views (full-text article views including HTML views, PDF and ePub downloads, according to the available data) and Abstracts Views on Vision4Press platform.
Data correspond to usage on the plateform after 2015. The current usage metrics is available 48-96 hours after online publication and is updated daily on week days.
Initial download of the metrics may take a while.