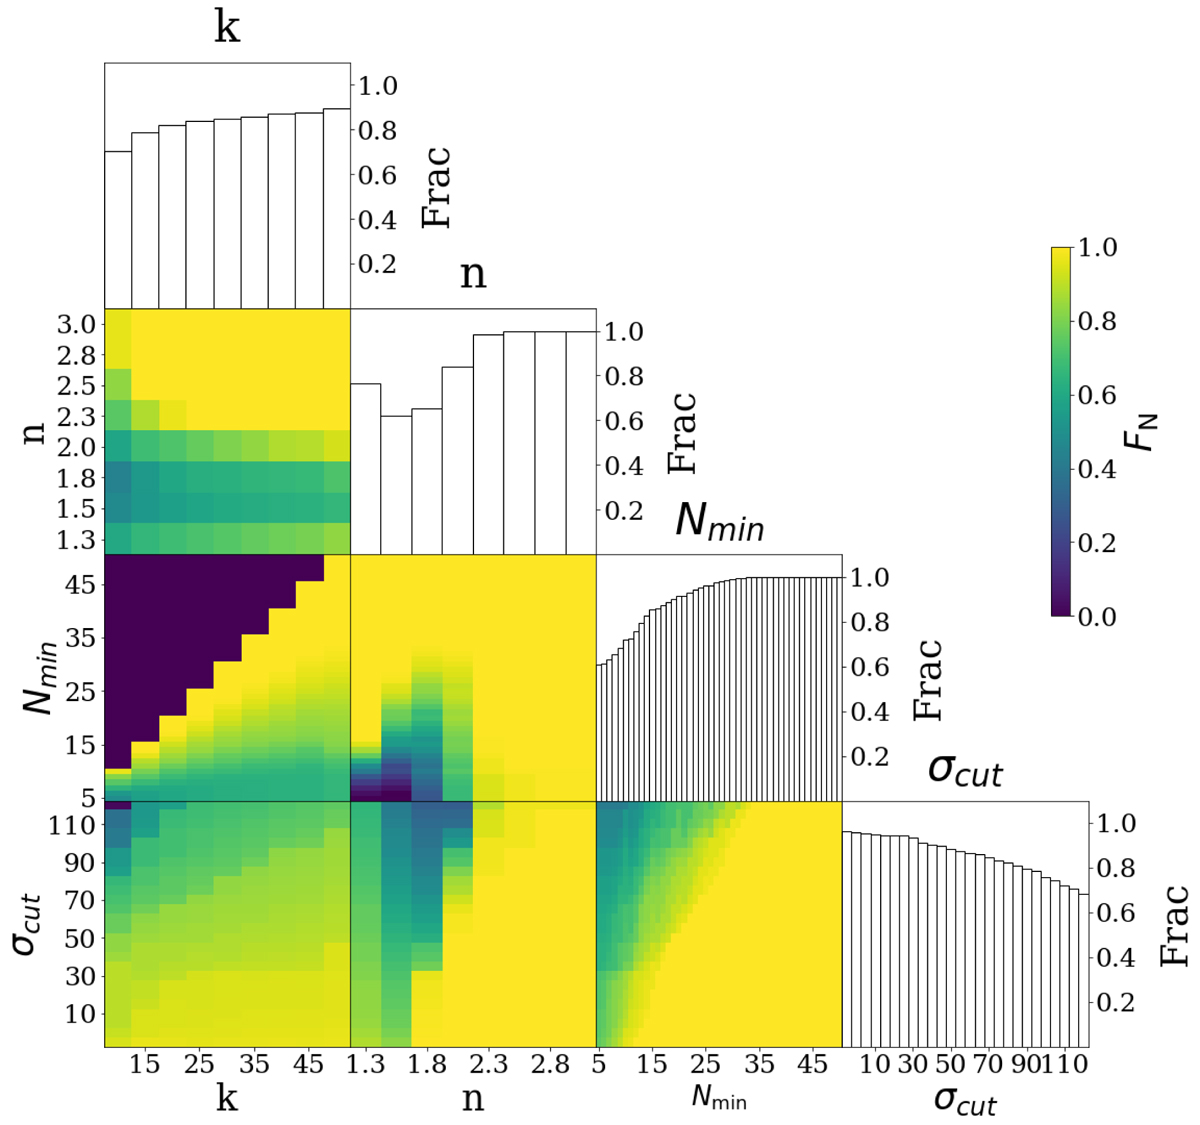
Fig. 7.
Download original image
Reliability map in the 4D parameter space for the simulated Fornax cluster. The 2D projected plots for each pair of parameters are color-coded according to the fraction of configurations (FN) with reliability ≥50% according to the legend. Histograms show the fraction of times the reliability passes the 50% threshold for each value of the four free parameters of COSTA.
Current usage metrics show cumulative count of Article Views (full-text article views including HTML views, PDF and ePub downloads, according to the available data) and Abstracts Views on Vision4Press platform.
Data correspond to usage on the plateform after 2015. The current usage metrics is available 48-96 hours after online publication and is updated daily on week days.
Initial download of the metrics may take a while.