Fig. 5.
Download original image
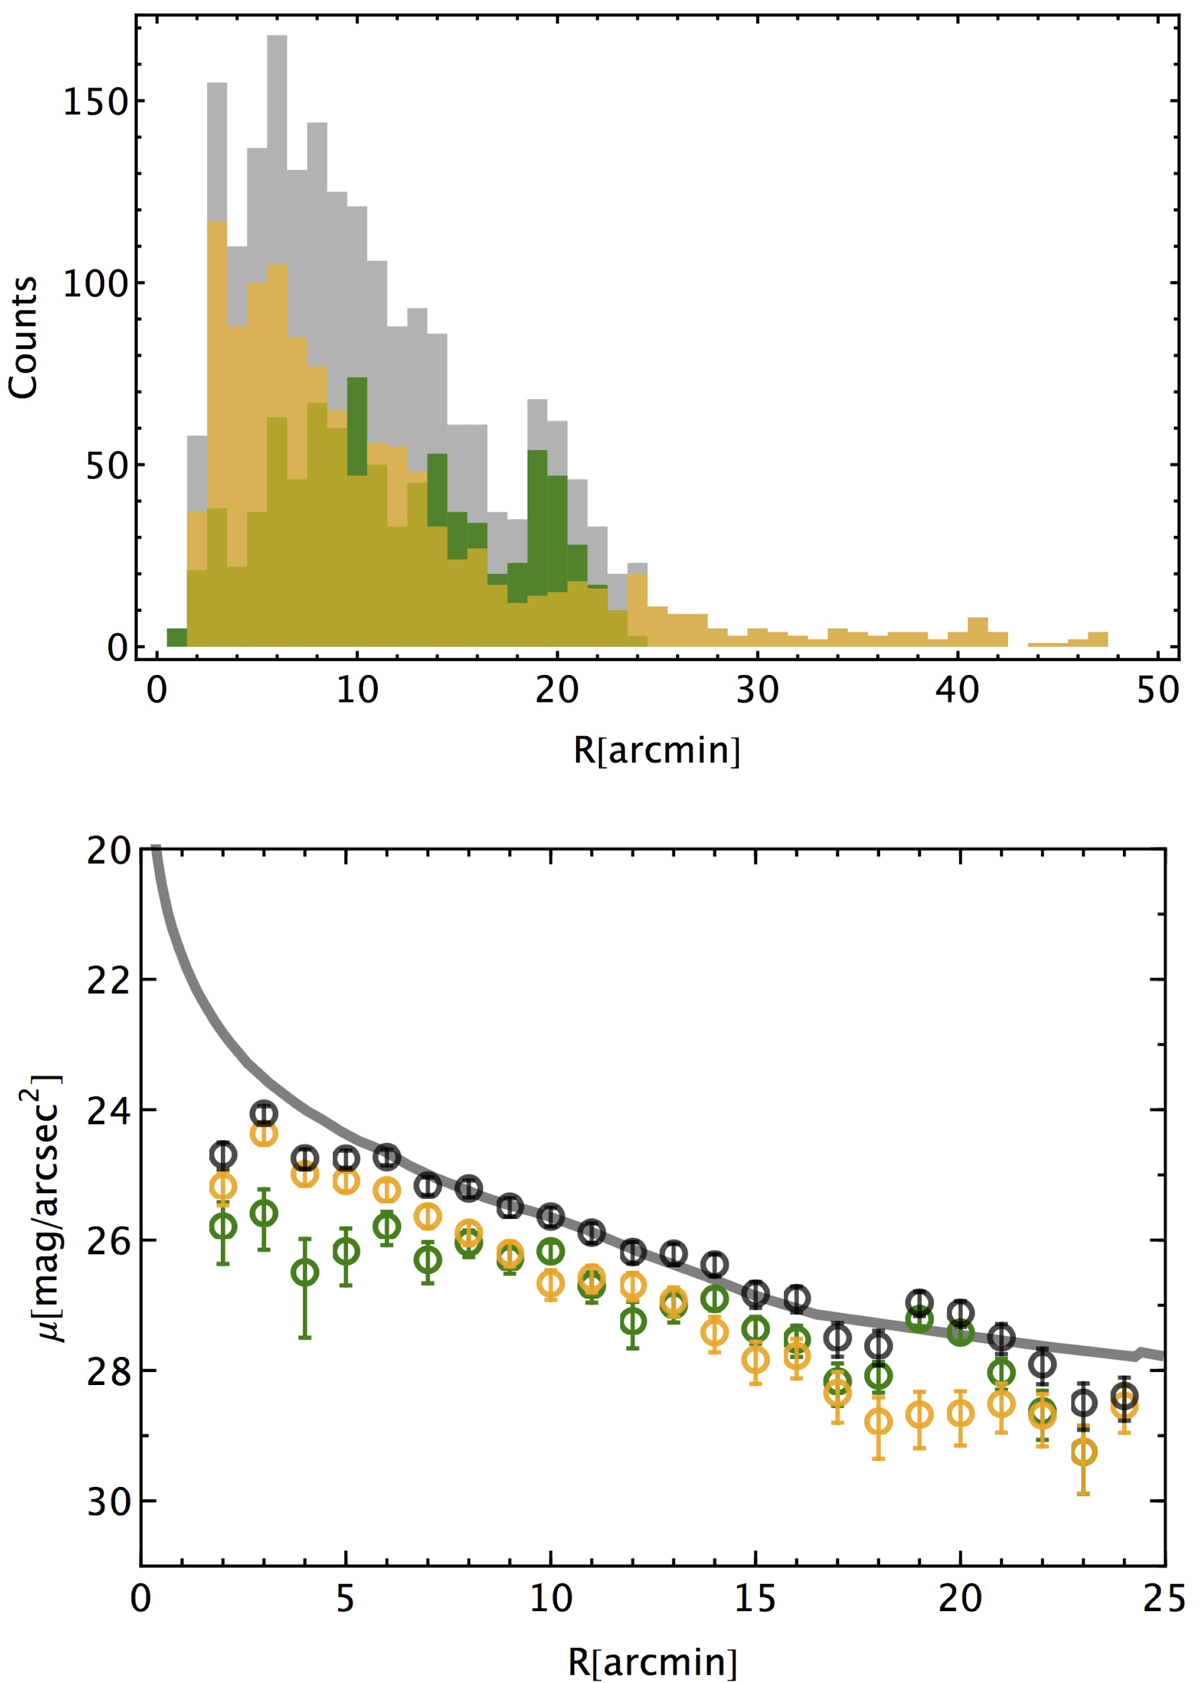
Top: number counts as a function of the radius of GCs (in yellow), PNe (in green), and the total population (in gray). The overdensity of PNe around NGC 1387 is clearly seen at R ∼ 20″ (see text). Bottom: radial density distribution of GCs (yellow open dots), PNe (green), and the total population (black), arbitrarily re-scaled to match the surface brightness of the Fornax core from I+16 (gray tick line). Error bars represent Poissonian errors on the tracer counts.
Current usage metrics show cumulative count of Article Views (full-text article views including HTML views, PDF and ePub downloads, according to the available data) and Abstracts Views on Vision4Press platform.
Data correspond to usage on the plateform after 2015. The current usage metrics is available 48-96 hours after online publication and is updated daily on week days.
Initial download of the metrics may take a while.