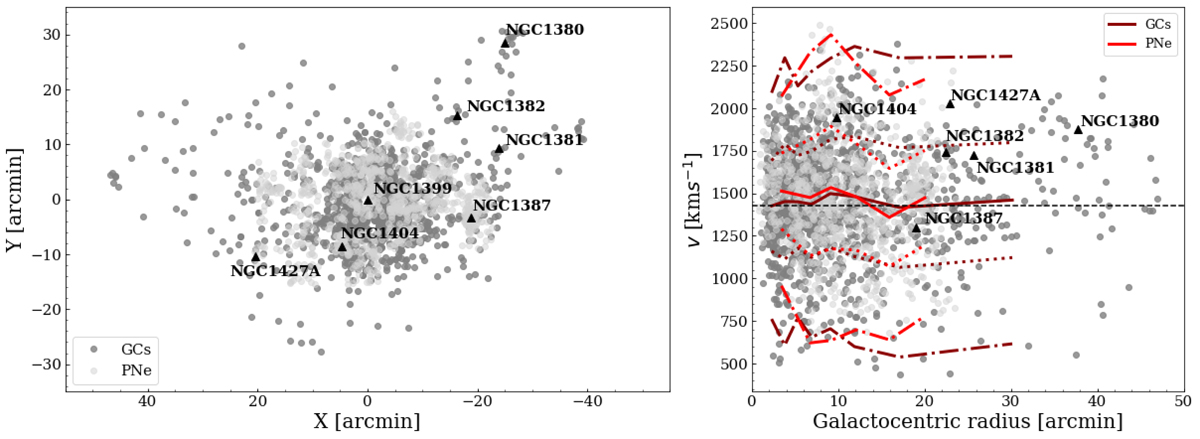
Fig. 4.
Download original image
Left: image of the whole sample of GCs (dark gray) and 887 bright PNe (light gray) in RA vs. Dec with the galaxies overplotted as black triangles. Right: GCs (dark gray) and PNe (light gray) in the phase space. The lines correspond to the mean velocity of the particles (solid line, dark red for the GCs and light red for the PNe), to the velocity dispersion at 1σ (dotted line), and to the velocity dispersion at 2.5σ (point-dotted line).
Current usage metrics show cumulative count of Article Views (full-text article views including HTML views, PDF and ePub downloads, according to the available data) and Abstracts Views on Vision4Press platform.
Data correspond to usage on the plateform after 2015. The current usage metrics is available 48-96 hours after online publication and is updated daily on week days.
Initial download of the metrics may take a while.