Free Access
Fig. D.1.
Download original image
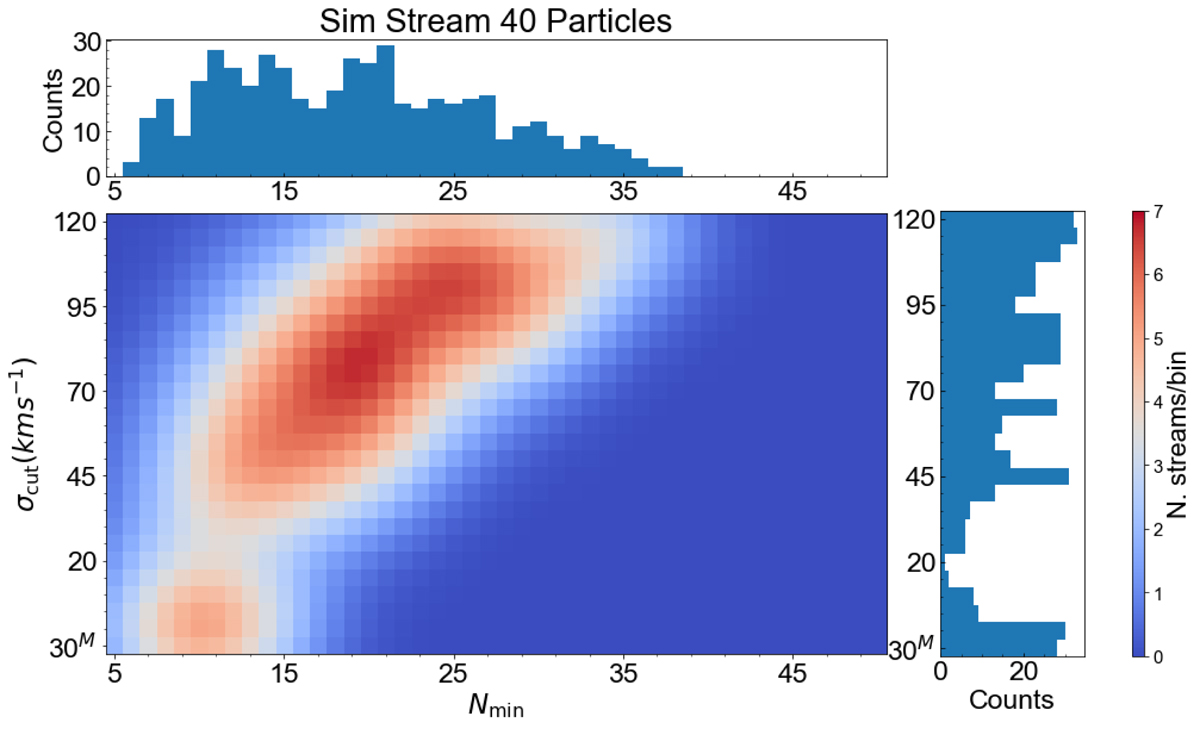
Density plot of the σcut as a function of Nmin for a simulated stream of stream 40 particles, 10′×5′ size, with an intrinsic velocity dispersion of 90 km s−1, mimicking a large stream as expected if FVSS-S2 and FVSS-S12 are part of a single substructure. Color code and smoothing are defined as in the real streams in Fig. 8.
Current usage metrics show cumulative count of Article Views (full-text article views including HTML views, PDF and ePub downloads, according to the available data) and Abstracts Views on Vision4Press platform.
Data correspond to usage on the plateform after 2015. The current usage metrics is available 48-96 hours after online publication and is updated daily on week days.
Initial download of the metrics may take a while.