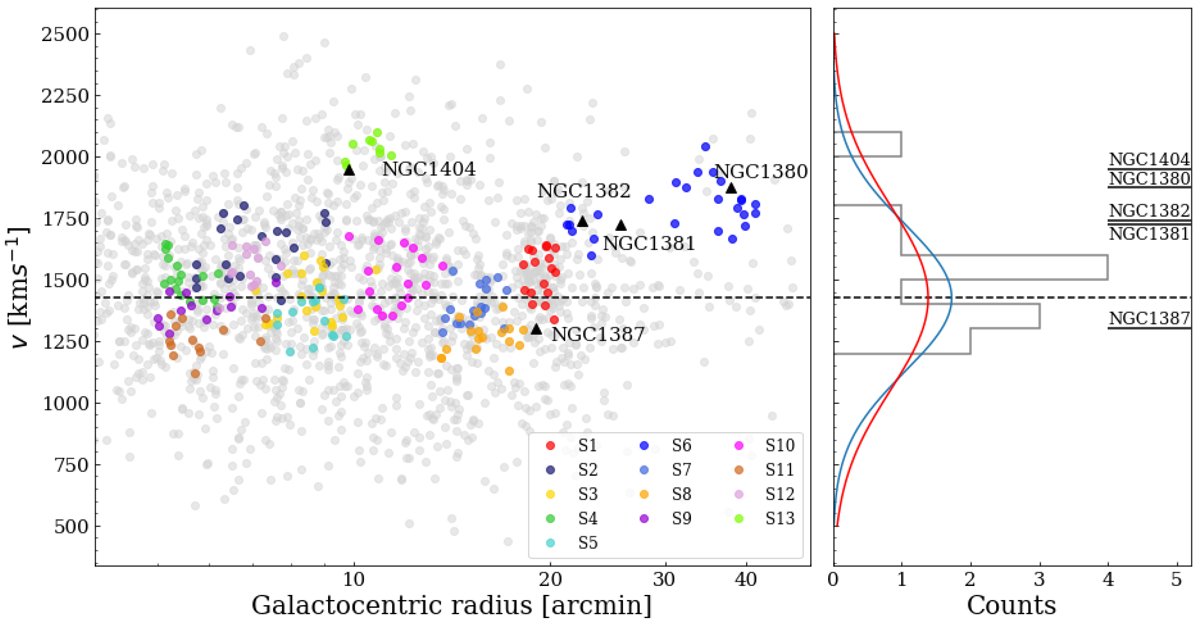
Fig. 10.
Download original image
Left: particles of each cold substructure in the phase space, with the same colors as in Fig. 9, superposed on all particles used in this work (light gray). Right: Gaussians with mean = 1425 km s−1, i.e., the NGC 1399 systemic velocity, and standard deviation of 300 km s−1 (blue solid lines) and 374 km s−1 (red solid lines), namely the velocity dispersion of the Fornax cluster and of the Fornax members analyzed by Drinkwater et al. (2001).
Current usage metrics show cumulative count of Article Views (full-text article views including HTML views, PDF and ePub downloads, according to the available data) and Abstracts Views on Vision4Press platform.
Data correspond to usage on the plateform after 2015. The current usage metrics is available 48-96 hours after online publication and is updated daily on week days.
Initial download of the metrics may take a while.