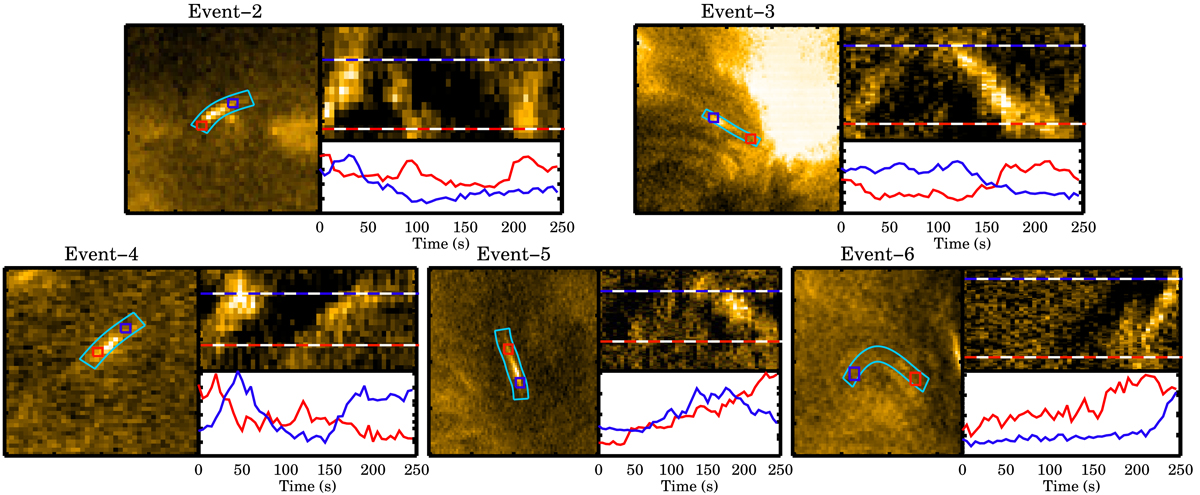
Fig. D.1.
Download original image
EUI light curves of events 2 to 6. In each of these panels, the curved box (in cyan) highlights the artificial slit, wherein the blue and red boxes mark the locations from which the light curves were derived. The centers of these boxes are also overplotted on top of the associated X-T map as straight horizontal lines. At the bottom of the X-T map, the light curves are shown in red and blue.
Current usage metrics show cumulative count of Article Views (full-text article views including HTML views, PDF and ePub downloads, according to the available data) and Abstracts Views on Vision4Press platform.
Data correspond to usage on the plateform after 2015. The current usage metrics is available 48-96 hours after online publication and is updated daily on week days.
Initial download of the metrics may take a while.