Fig. B.1.
Download original image
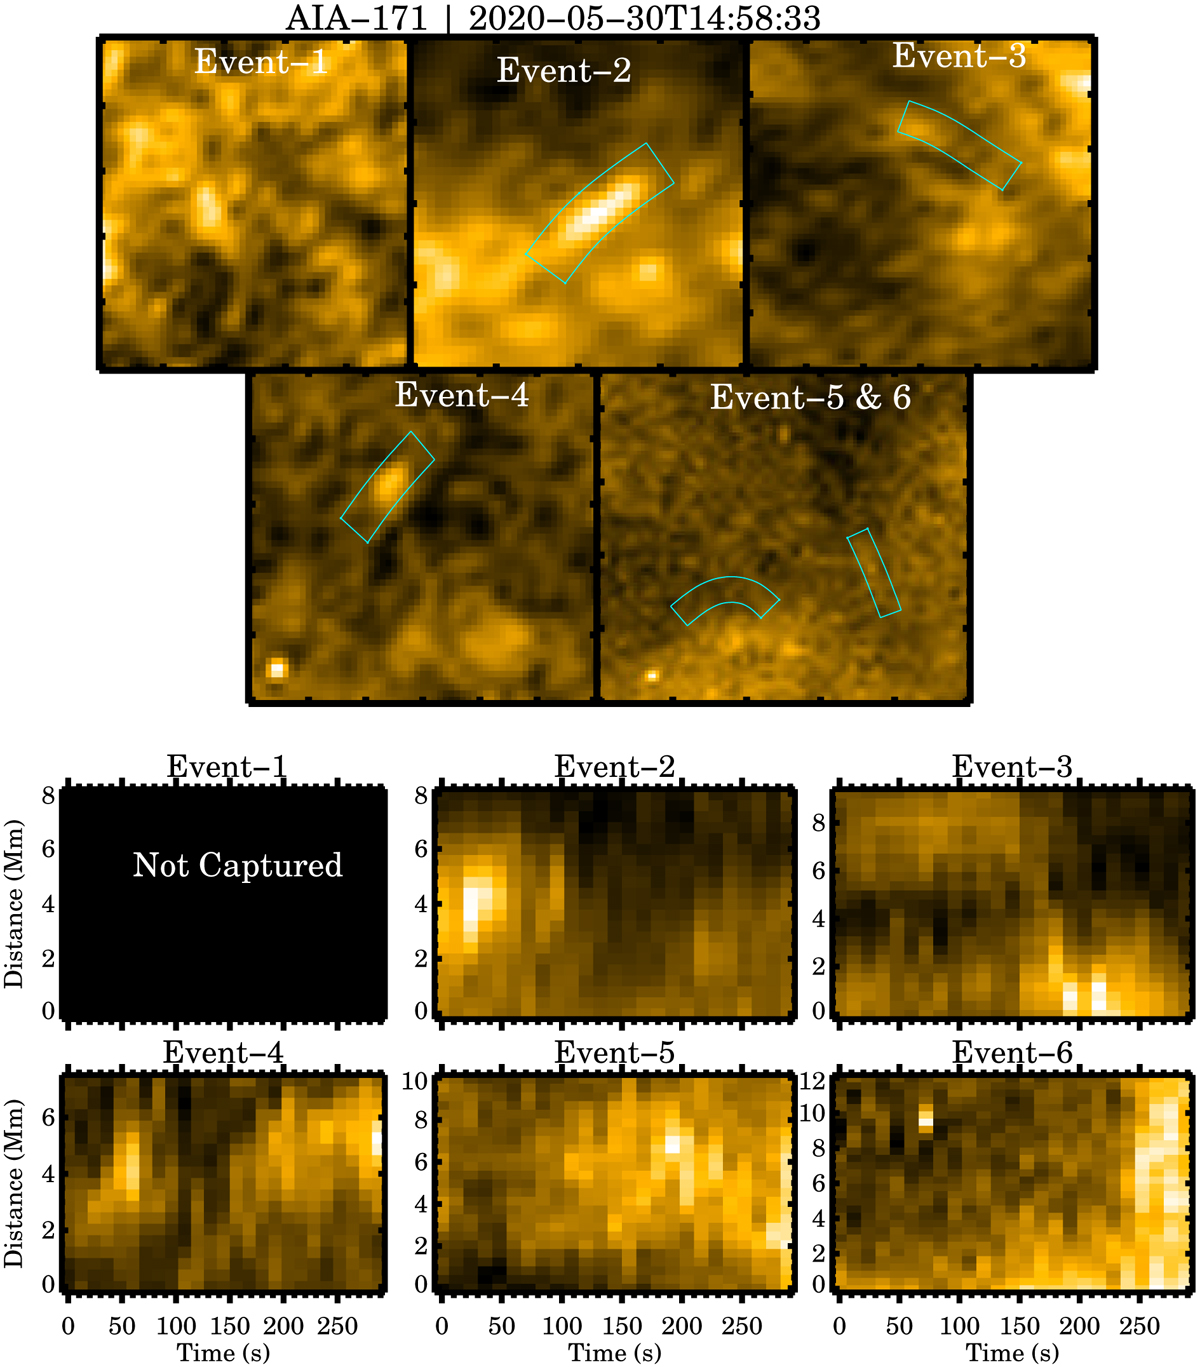
AIA view of propagating campfires. The set of five panels at the top presents AIA snapshots of each of our six events. The curved boxes shown in each of these panels mark the locations of the artificial slits we used to derive the temporal evolution in the X-T maps. These X-T maps are shown in the bottom set of panels. Because we were unable to identify event 1 in AIA, we left the corresponding X-T map blank. An animated version of this figure is available online.
Current usage metrics show cumulative count of Article Views (full-text article views including HTML views, PDF and ePub downloads, according to the available data) and Abstracts Views on Vision4Press platform.
Data correspond to usage on the plateform after 2015. The current usage metrics is available 48-96 hours after online publication and is updated daily on week days.
Initial download of the metrics may take a while.