Fig. 3.
Download original image
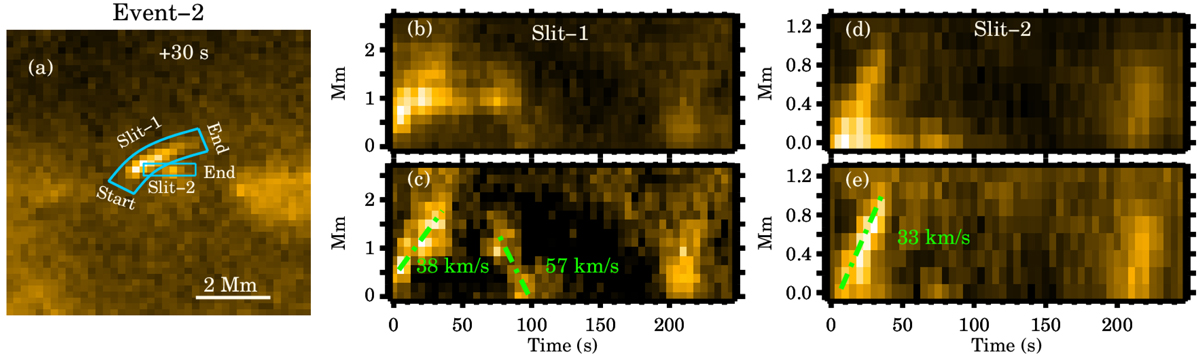
Overview of bifurcation scenario 2 (event 2). The layout is similar as in Figs. 2a–c. Panel a: context image. The curved blue boxes mark the locations of the artificial slits (slit 1 and slit 2). Panels b and c: original and background-subtracted space-time maps for slit 1. Panels d and e: the same but, for slit 2. The dashed green lines indicate the slopes of the ridges we used to estimate the speed. See Sect. 3.3 for details. An animated version of this figure is available online.
Current usage metrics show cumulative count of Article Views (full-text article views including HTML views, PDF and ePub downloads, according to the available data) and Abstracts Views on Vision4Press platform.
Data correspond to usage on the plateform after 2015. The current usage metrics is available 48-96 hours after online publication and is updated daily on week days.
Initial download of the metrics may take a while.