Fig. 2.
Download original image
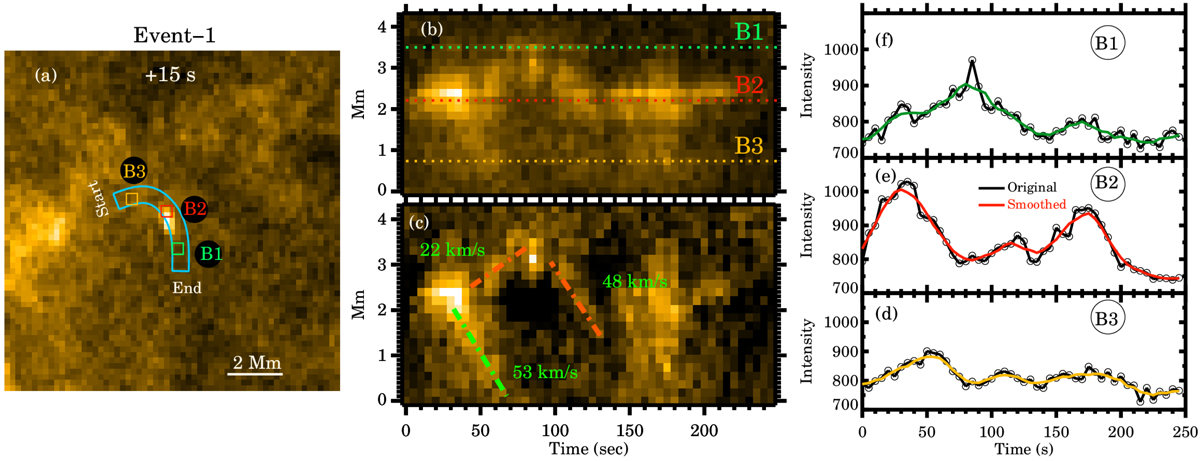
Bifurcation scenario 1 (event 1). Panel a: context image for this event along with the artificial slit (curved blue box) that we used to generate the space-time (X − T) map (panel b). The background-subtracted version of this map is shown in panel c. The label ‘start’ (‘end’) in panel a refers to the origin (end point) of the y-axis of the X − T map. The inclined dash-dotted green and orange lines in panel c represent the slopes of the individual ridges we used to estimate the speed. The dash-dotted orange lines encapsulate the inverse-v shape that indicates a reflection at the loop footpoint. Panels d–f: light curves that we extracted from the three square boxes B1, B2, and, B3 as shown in panel a. The center points of these boxes are highlighted as horizontal lines in panel-b. For more details, see Sect. 3.2. (An animated version of this figure is available online.)
Current usage metrics show cumulative count of Article Views (full-text article views including HTML views, PDF and ePub downloads, according to the available data) and Abstracts Views on Vision4Press platform.
Data correspond to usage on the plateform after 2015. The current usage metrics is available 48-96 hours after online publication and is updated daily on week days.
Initial download of the metrics may take a while.