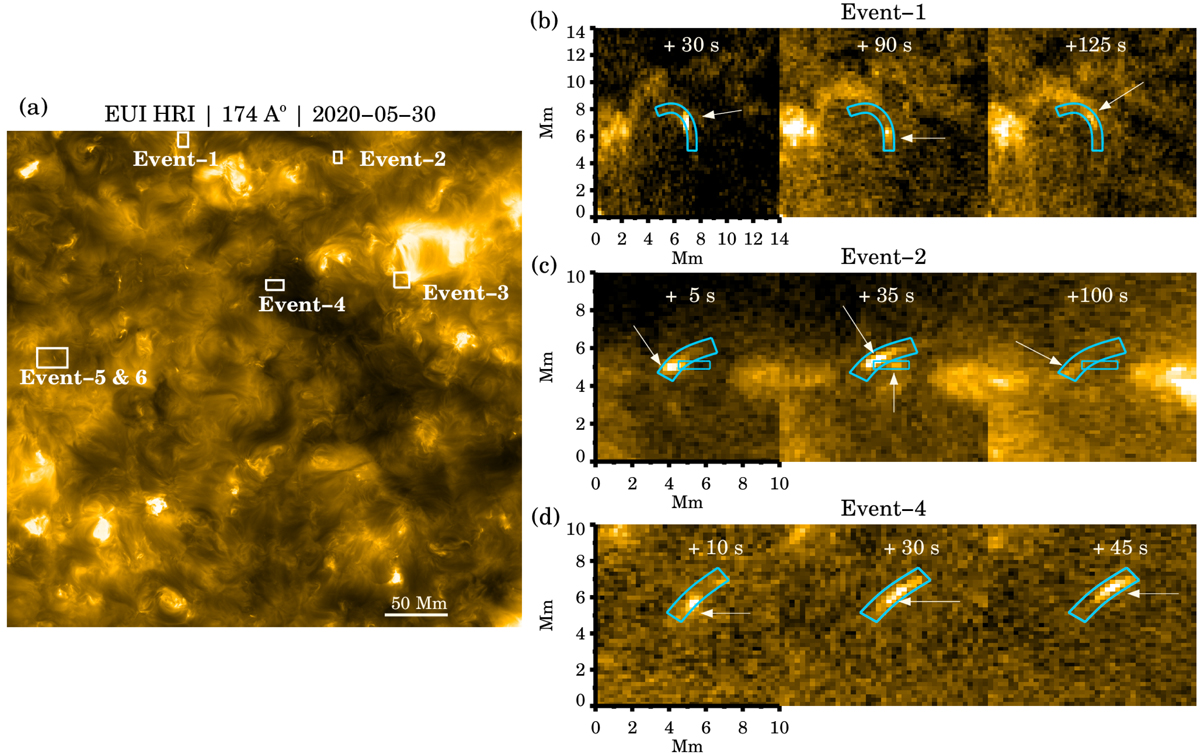
Fig. 1.
Download original image
Internal dynamics in small loop-like features. Panel a: time-averaged image of the HRIEUV observation on 30 May 2020. White boxes outline the locations of the six events studied here. Panels b and d: snapshots from events 1 and 2 and from event 4, respectively. In each of these snapshots, the curved blue box marks the extent of the artificial slit that is used to derive the space-time map, and the arrow points to the instantaneous position of the localized brightening in that frame. The elapsed time for each frame is given in seconds as measured from 14:54:00 UT, i.e., the start time of the observation.
Current usage metrics show cumulative count of Article Views (full-text article views including HTML views, PDF and ePub downloads, according to the available data) and Abstracts Views on Vision4Press platform.
Data correspond to usage on the plateform after 2015. The current usage metrics is available 48-96 hours after online publication and is updated daily on week days.
Initial download of the metrics may take a while.