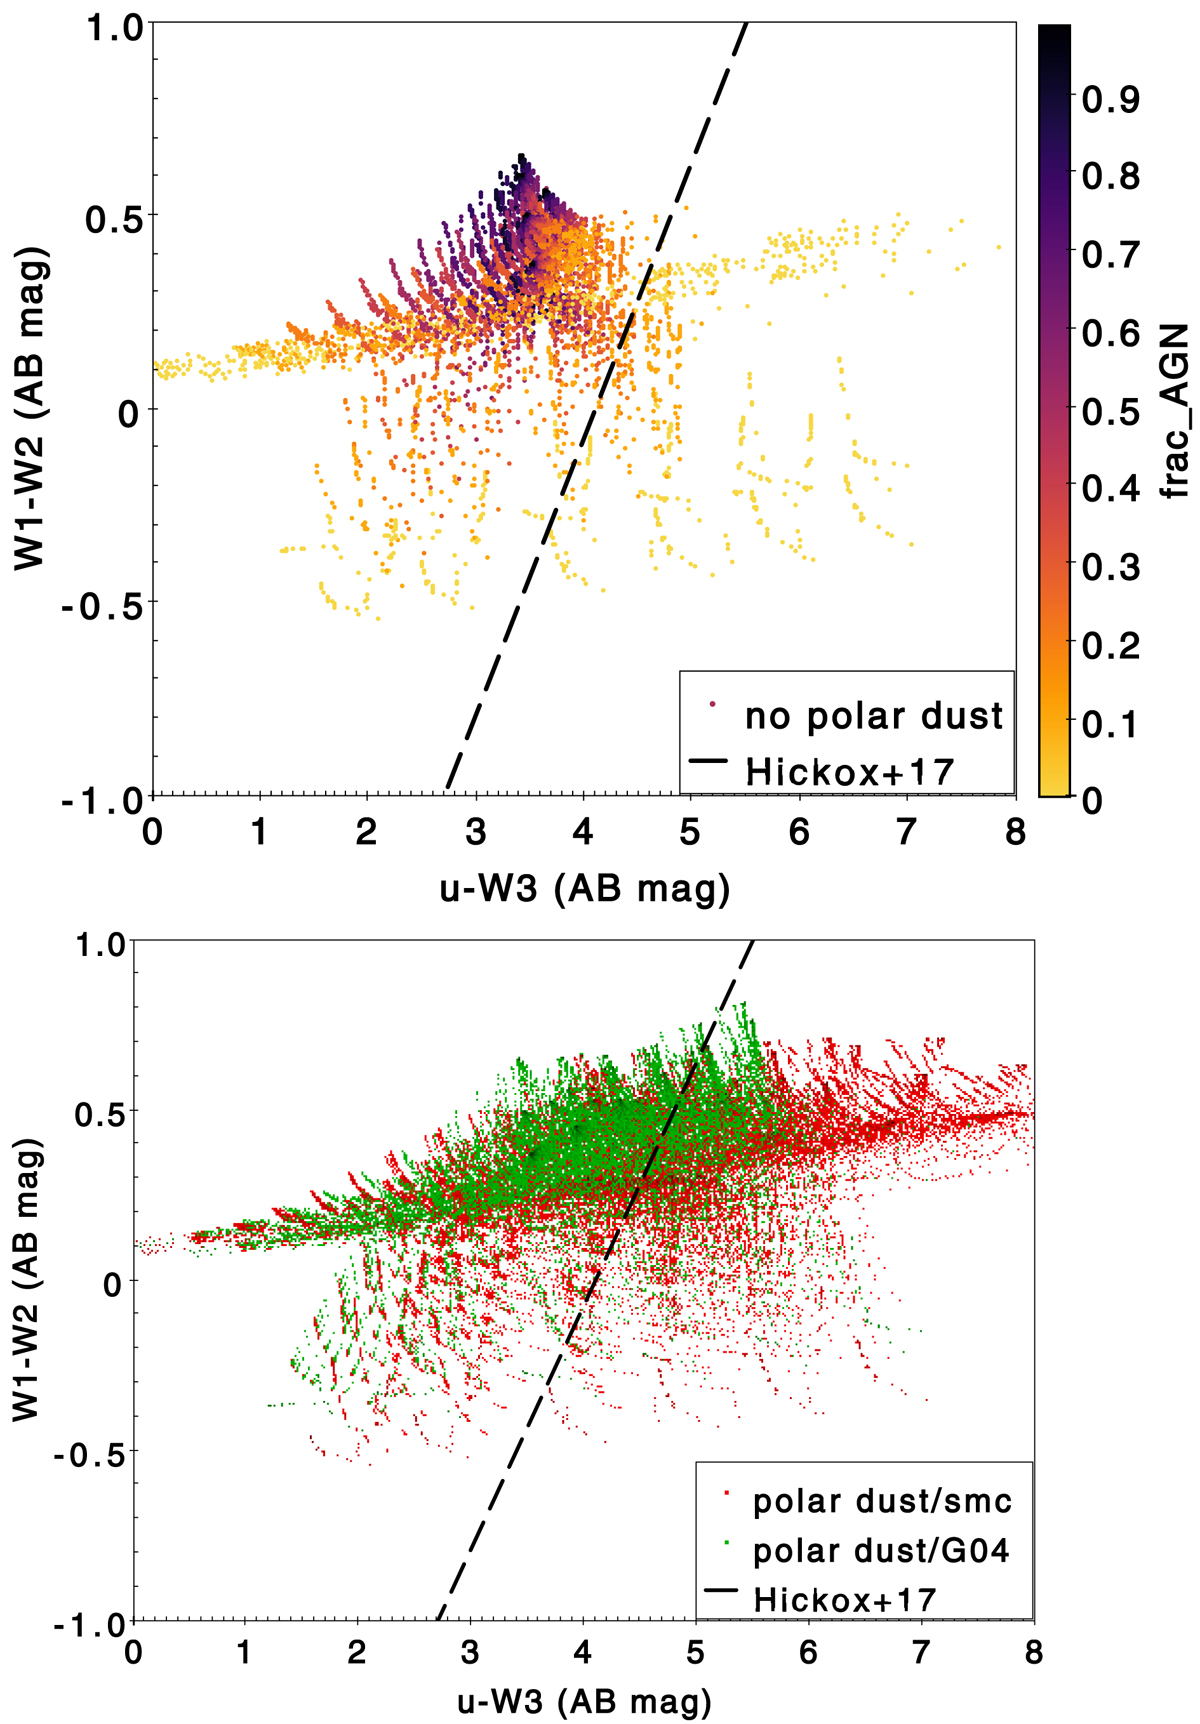
Fig. 2.
Download original image
Distribution of composite models in the u-W3, W1-W2 color plot. The models are created with X-CIGALE for an AGN type 1 and a host galaxy from z = 0 to z = 2.5. Top panel: no obscuration by polar dust is considered. The relative contribution of both components defined by the fraction of the dust luminosity coming from the AGN is color coded. Bottom panel: polar dust obscuration is added. Models generated with the SMC (resp., G04) extinction curve are plotted as red (resp., green). The SMC extinction curve leads to a larger reddening of the u-W3 color. All magnitudes are in AB units and the line boundary defined by Hickox et al. (2017) to identify obscured quasars is modified accordingly (u − W3 = 1.4 × (W1 − W2) + 4.1). The number of G04 models is reduced by a factor of 2 on the figure for a better visibility for both distributions.
Current usage metrics show cumulative count of Article Views (full-text article views including HTML views, PDF and ePub downloads, according to the available data) and Abstracts Views on Vision4Press platform.
Data correspond to usage on the plateform after 2015. The current usage metrics is available 48-96 hours after online publication and is updated daily on week days.
Initial download of the metrics may take a while.