Fig. 5
Download original image
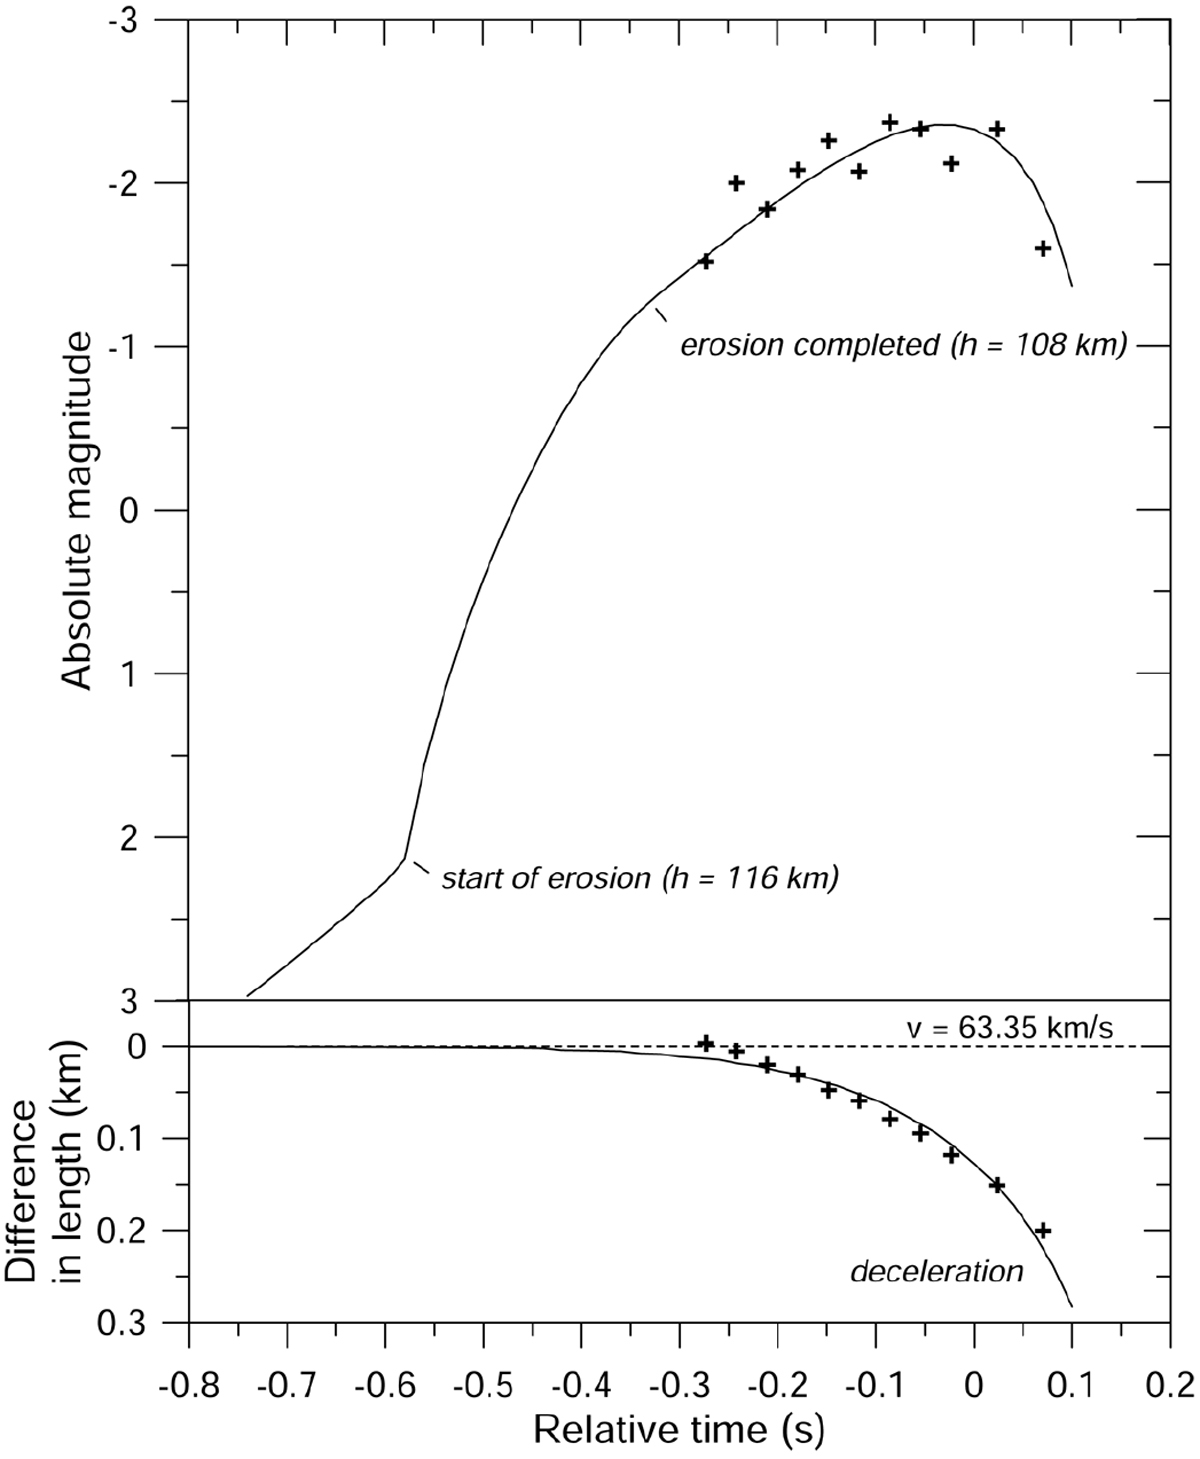
Comparison of observed and modeled light curves (upper panel) and deceleration (lower panel) of the 4:58:28 UT meteor. Observed data are given as crosses, and the model is shown with smooth solid lines. Deceleration is expressed as the difference of the length along the trajectory (of the brightest part of meteor streak) at the given time from the length expected for constant meteor velocity of 63.35 km s−1. CIRA72 model atmosphere was used to compute the drag.
Current usage metrics show cumulative count of Article Views (full-text article views including HTML views, PDF and ePub downloads, according to the available data) and Abstracts Views on Vision4Press platform.
Data correspond to usage on the plateform after 2015. The current usage metrics is available 48-96 hours after online publication and is updated daily on week days.
Initial download of the metrics may take a while.