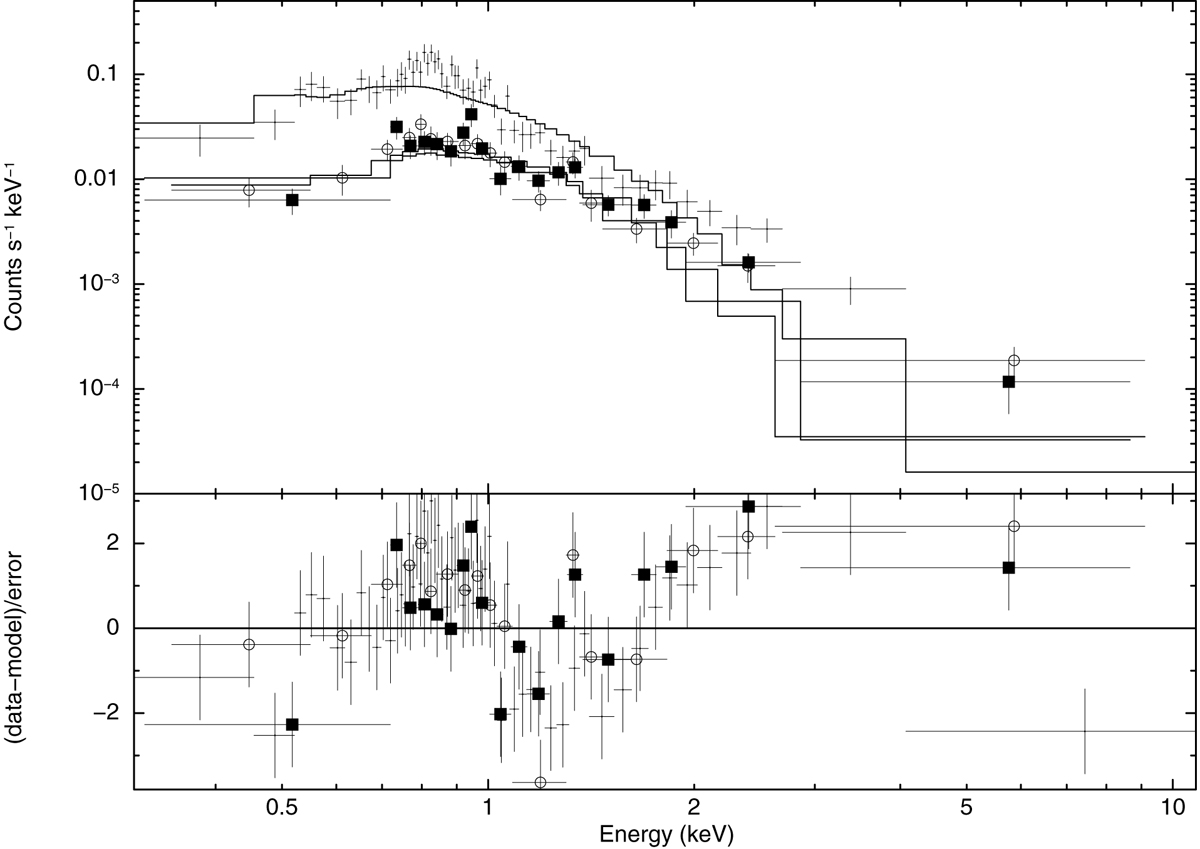
Fig. 3.
Download original image
EPIC spectra extracted from the lowest state, fit by a single absorbed power-law model. Upper panel: count spectra, lower panel: residuals with respect to the model in terms of standard deviation. The meaning of the symbols is the following: crosses, empty circles, and solid squares mark the EPIC pn, MOS1, and MOS2 spectra, respectively.
Current usage metrics show cumulative count of Article Views (full-text article views including HTML views, PDF and ePub downloads, according to the available data) and Abstracts Views on Vision4Press platform.
Data correspond to usage on the plateform after 2015. The current usage metrics is available 48-96 hours after online publication and is updated daily on week days.
Initial download of the metrics may take a while.