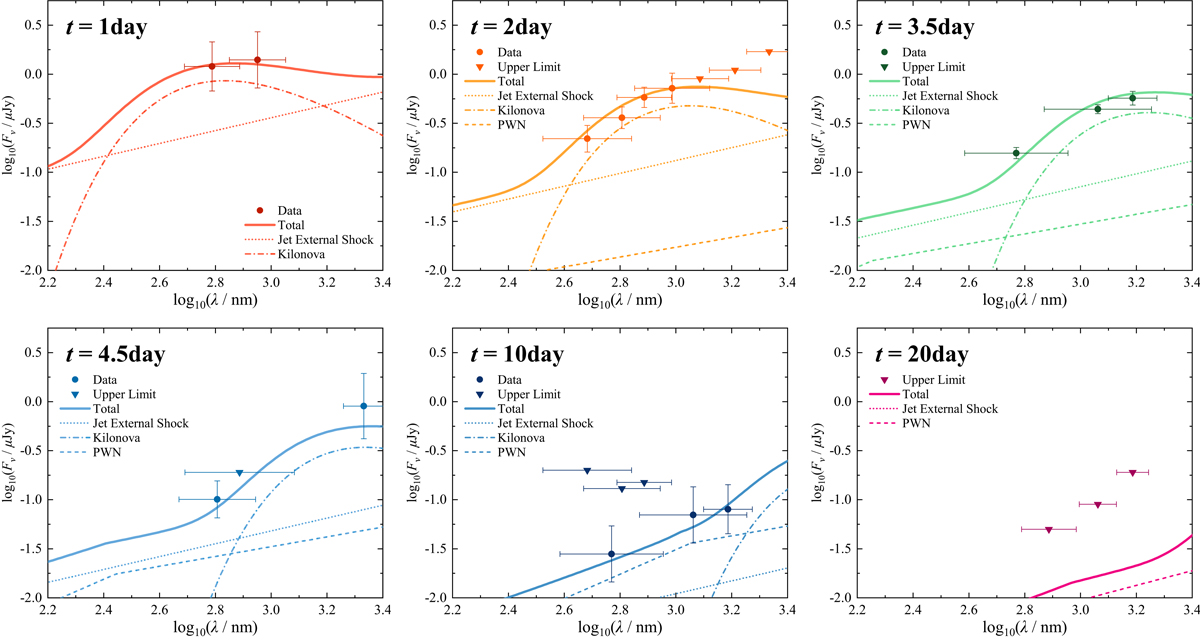
Fig. 2.
Download original image
Ultraviolet–optical–infrared spectra of the afterglow emission of GRB 160821B for different times as labeled. The observational data are taken from (Lamb et al. 2019; Troja et al. 2019). The dotted, dash-dotted, dashed, and solid lines correspond to the emissions of the jet external shock, the thermal kilonova, the PWN, and their combination, respectively.
Current usage metrics show cumulative count of Article Views (full-text article views including HTML views, PDF and ePub downloads, according to the available data) and Abstracts Views on Vision4Press platform.
Data correspond to usage on the plateform after 2015. The current usage metrics is available 48-96 hours after online publication and is updated daily on week days.
Initial download of the metrics may take a while.