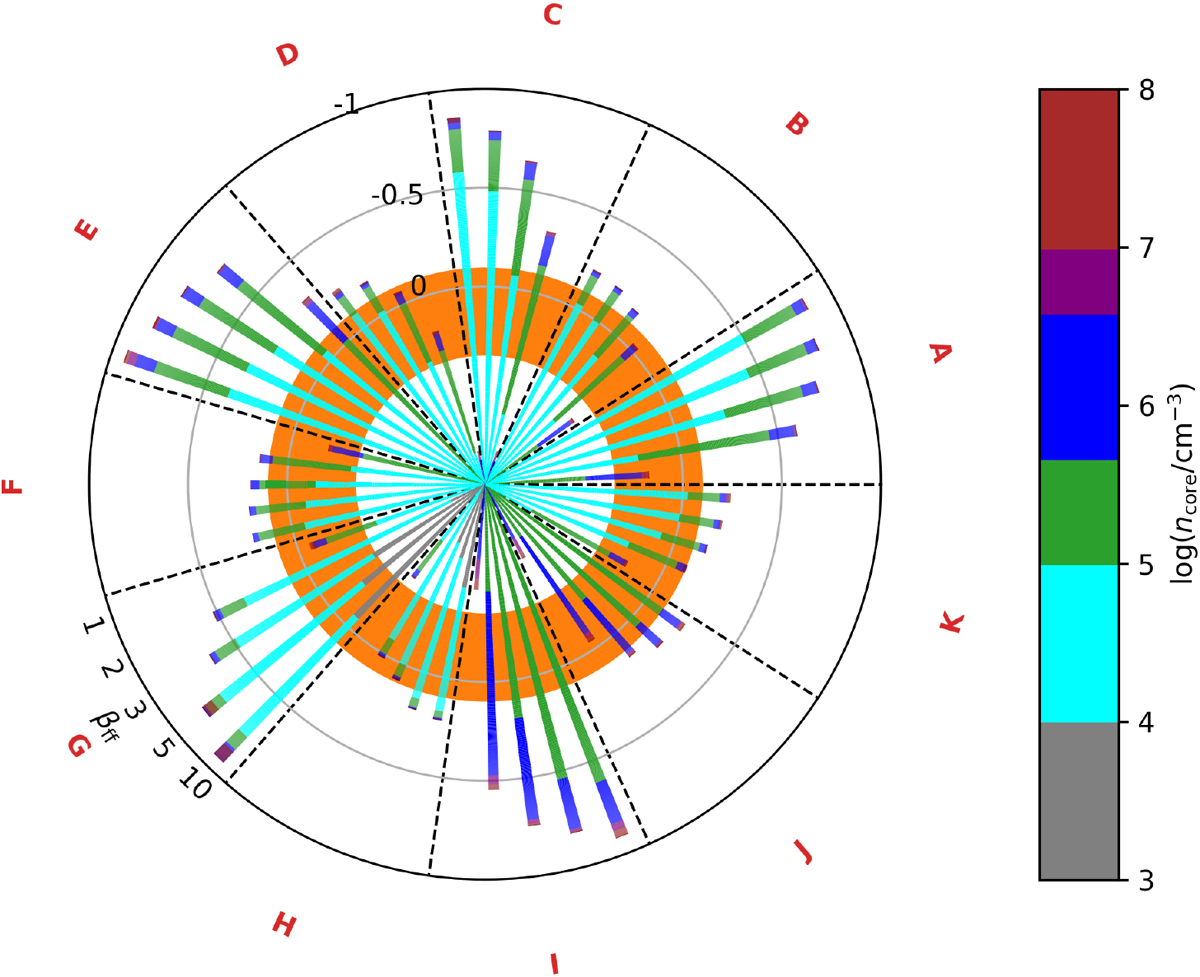
Fig. B.2
Download original image
Polar-like chart summarising the results of our parameter study. Each slice represents a model (labelled with letters) with fixed initial conditions in terms of T, ζ2, initial density ncore, and initial H2 OPR (see Table B.1). Within the model slice, the different collapse speed cases defined by the parameter βff are represented by a stacked bar. The radial evolution of the bar reflects the oH2 D+/pD2H+ evolution and the bars are coloured by density (see associated colour bar). The orange ring was delimited by the observed oH2 D+/pD2H+ ratio and the blue region in the colour bar was set by the density of the observed cores (see also Table 1). This means that we have a match between the models and the observations when the blue frame of the bar falls into the orange region.
Current usage metrics show cumulative count of Article Views (full-text article views including HTML views, PDF and ePub downloads, according to the available data) and Abstracts Views on Vision4Press platform.
Data correspond to usage on the plateform after 2015. The current usage metrics is available 48-96 hours after online publication and is updated daily on week days.
Initial download of the metrics may take a while.