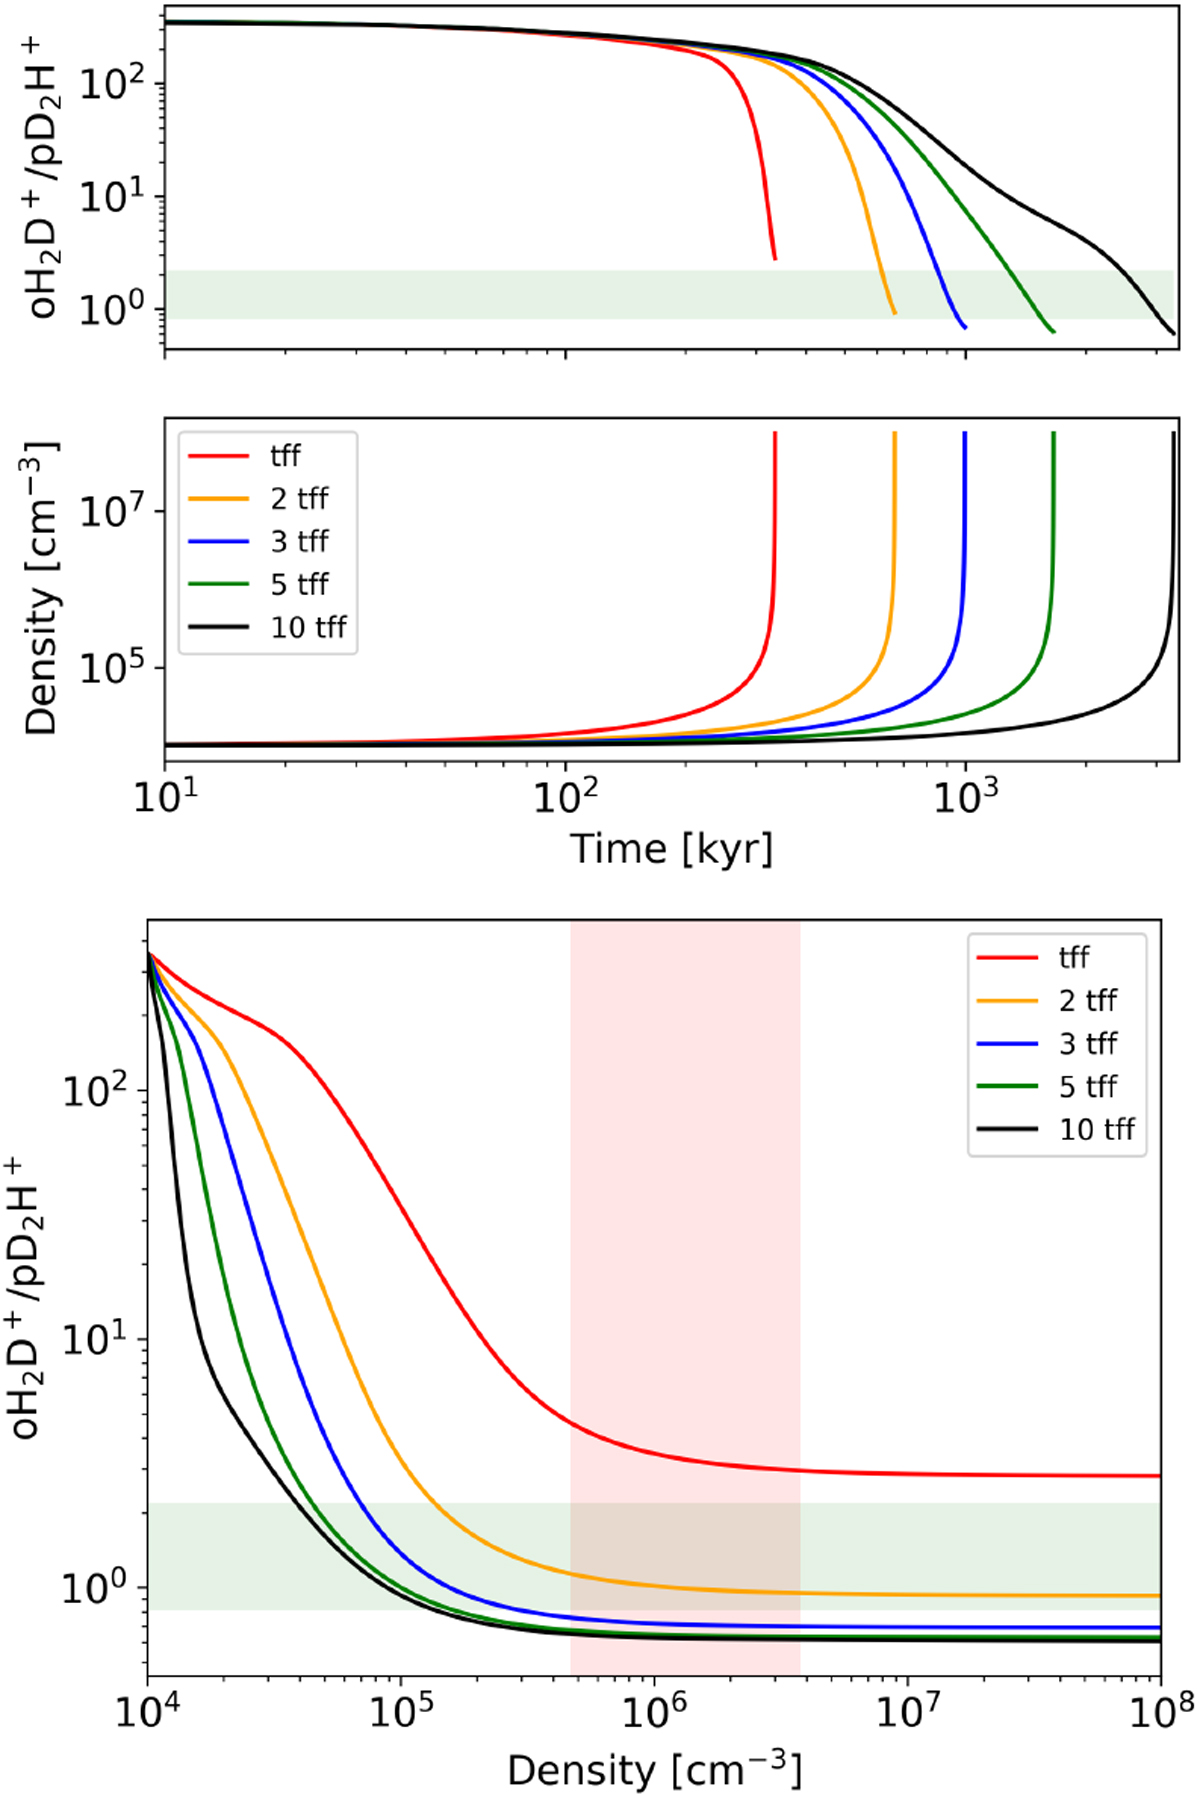
Fig. B.1
Download original image
Top: Time evolution of the ortho-H2D+/para-D2H+ ratio (top) and density (bottom) for a reference case with ncore = 104 cm−3, T = 10 K, CRIR = 2.5 × 10⁻¹⁷ s−1, and initial H2 OPR = 0.1, for different collapse speeds (βff = [1, 2, 3, 5, 10]). The green shaded area represents the range of observed values, only detections are considered in this specific case (see Table 2). Bottom: Evolution of the ortho-H2D+/para-D2H+ ratio with respect to the density for the same parameters. The red shaded area represents the range of densities for the observed cores.
Current usage metrics show cumulative count of Article Views (full-text article views including HTML views, PDF and ePub downloads, according to the available data) and Abstracts Views on Vision4Press platform.
Data correspond to usage on the plateform after 2015. The current usage metrics is available 48-96 hours after online publication and is updated daily on week days.
Initial download of the metrics may take a while.