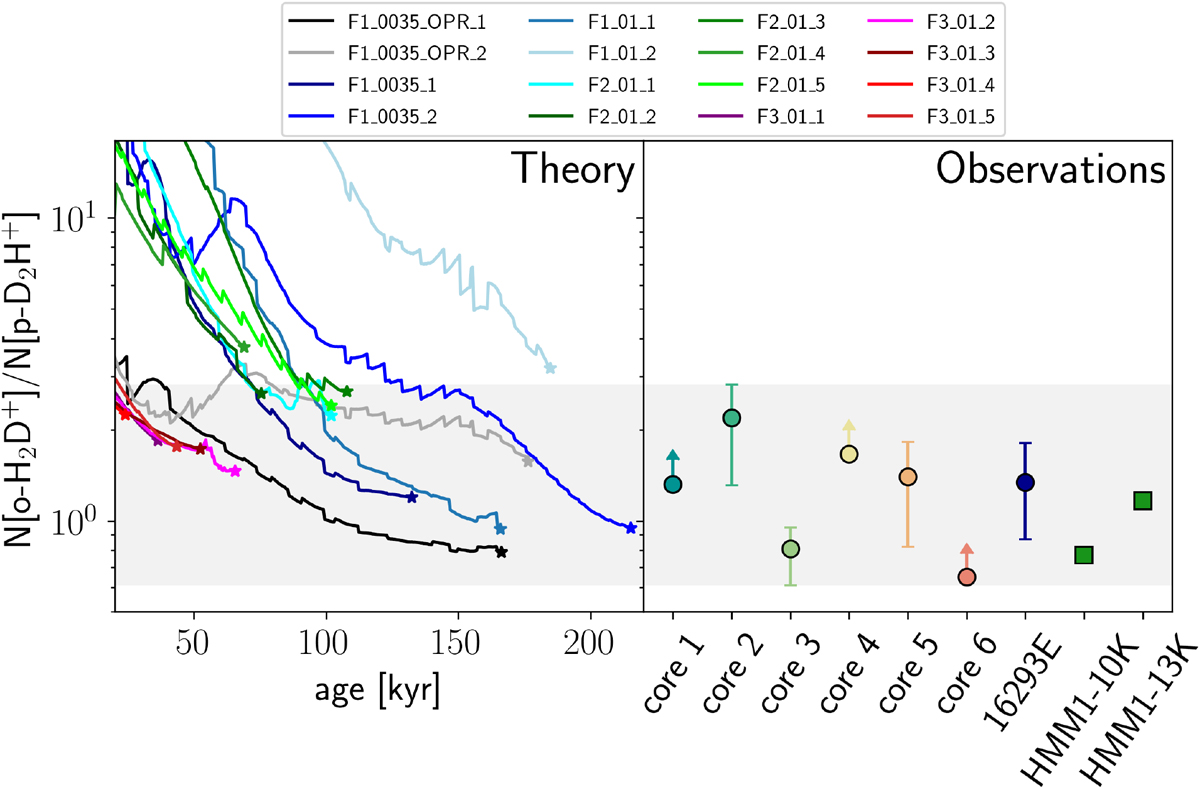
Fig. 6
Download original image
Comparison of the N[o-H2D+]/N[p-D2H+] ratio between observations and simulations. The different curves in the left panel refer to the time evolution of the cores identified within the simulations with a different set of physical and chemical conditions (see Tables 3 and 4 for details). We note that some cores are the result of merging and dissolving processes, which produce the visible oscillations in the curves. The stars represent tage, i.e. the time at which the minimum o-H2D+/p-D2H+ ratio is reached for each core and the point where we performed the calculations of the properties reported in Table 4 and the comparison with the observed cores. The right panel shows the observed values: the ones labelled 1–6 represent our APEX data, 16293E (blue circle) refers to previous observations of the two studied isotopologues (Vastel et al. 2004), and HMM1-10K and HMM1-13K (green squares) are taken from observations in the L1688 cloud(Parise et al. 2011). The grey shaded area represents the range of observed values with secure detection, considering their uncertainties.
Current usage metrics show cumulative count of Article Views (full-text article views including HTML views, PDF and ePub downloads, according to the available data) and Abstracts Views on Vision4Press platform.
Data correspond to usage on the plateform after 2015. The current usage metrics is available 48-96 hours after online publication and is updated daily on week days.
Initial download of the metrics may take a while.