Fig. 4
Download original image
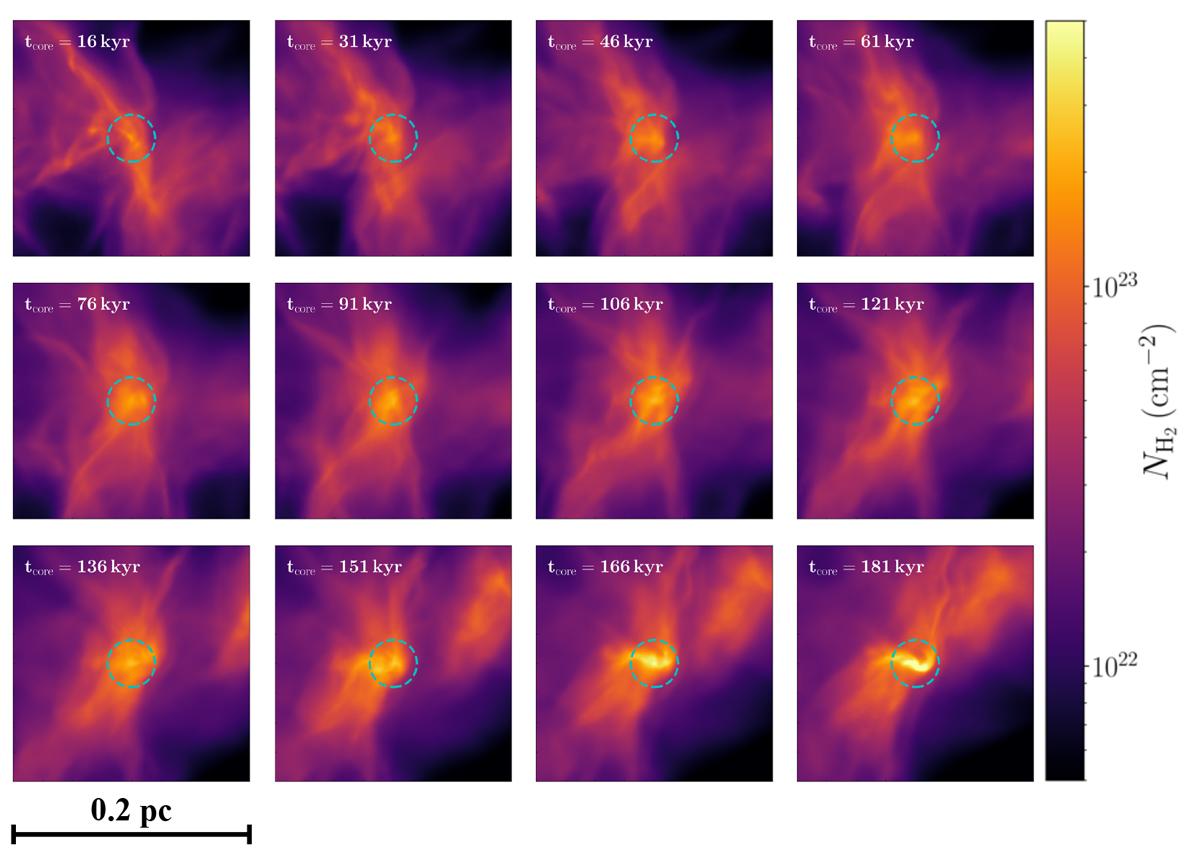
Zoom on the core F1_01_1 reported in Fig. 2 within the filament (core on the right, see also Table 4). The time evolution starts from tcore =16 kyr and goes up to the time at which a sink particle (i.e. a protostellar object) is formed, tcore =181 kyr. The dashed circle represents the area over which we average the core quantities reported in Table 4, which corresponds to 0.02 pc (Herschel-beam) centred in the column density peak. We note that these maps are not convolved.
Current usage metrics show cumulative count of Article Views (full-text article views including HTML views, PDF and ePub downloads, according to the available data) and Abstracts Views on Vision4Press platform.
Data correspond to usage on the plateform after 2015. The current usage metrics is available 48-96 hours after online publication and is updated daily on week days.
Initial download of the metrics may take a while.