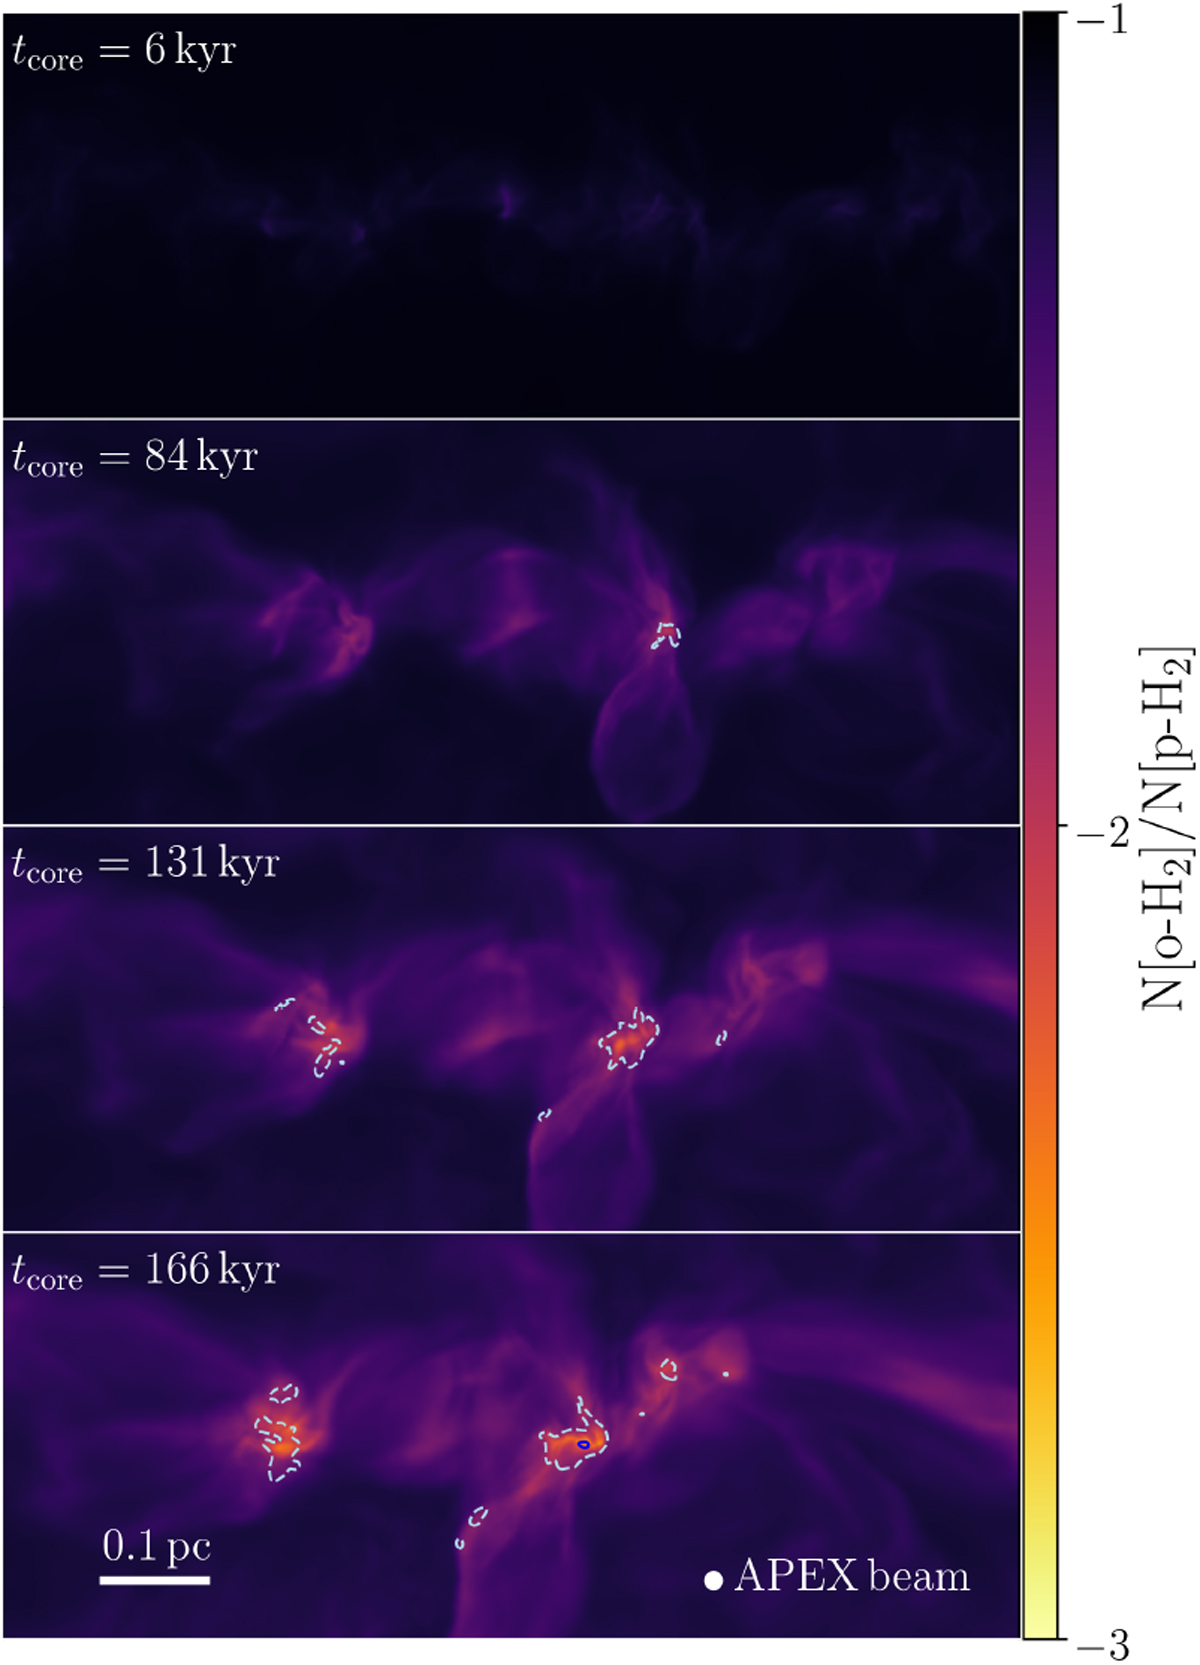
Fig. 3
Download original image
o/p H2 from the reference run F1_01 for different snapshots in time. Contour regions represent the N(o-H2D+)/N(p-D2H+), where the dashed contour has a value of 5 and solid contour 1. As a reference, we also report the APEX beam used in the observations(18′′), the spatial scale in parsec, and the age of the core (tcore). The total H2 column density distribution is shown after convolution with a typical Herschel beam of 36′′. The ratio was calculated on a pixel-to-pixel basis.
Current usage metrics show cumulative count of Article Views (full-text article views including HTML views, PDF and ePub downloads, according to the available data) and Abstracts Views on Vision4Press platform.
Data correspond to usage on the plateform after 2015. The current usage metrics is available 48-96 hours after online publication and is updated daily on week days.
Initial download of the metrics may take a while.